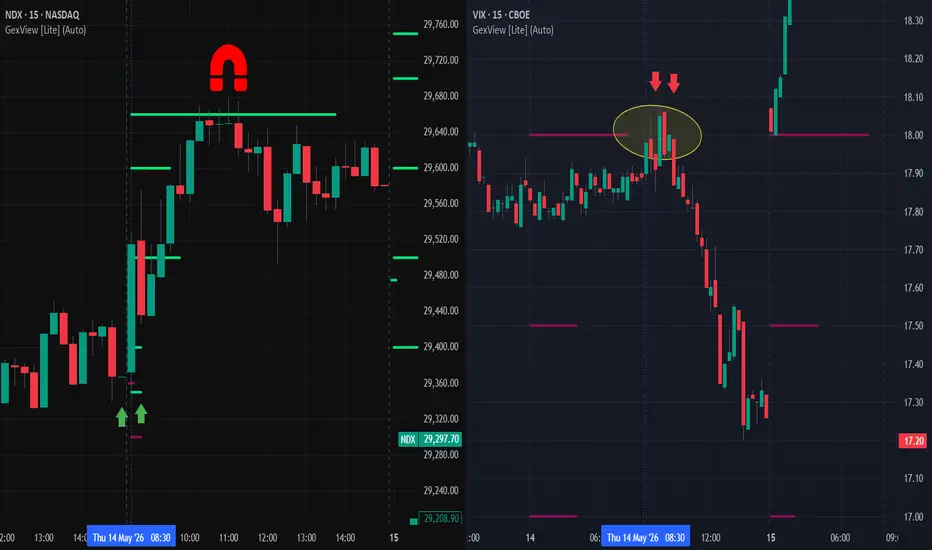
This example is from May 14, 2026.
My setup is based on Gamma Exposure (GEX):
1. Left Chart
Ticker: Nasdaq 100 Index ( NDX )
NDX )
Gamma Exposure: 0DTE (expiration: May 14, 2026)
Time Trigger: Regular Trading Hours (RTH) opening
Target: The largest 0DTE GEX level at 29,660, which tends to act as a magnet price level.
2. Right Chart
Ticker: Volatility Index ( VIX )
VIX )
Gamma Exposure: Nearest expiration (May 19, 2026)
Pattern: A false breakout inVIX above the largest GEX level (18), while at the same time NDX begins moving toward its intraday target.
I see this pattern occur very frequently. I focus on identifying the largest 0DTE GEX level in a major asset such as SPX ,
SPX ,  SPY , NDX , or
  QQQ , and then look for confirmation from the opposite move in
  VIX .
VIX .
As Linda Raschke said:
“All you need is one pattern to make a living.”
My setup is based on Gamma Exposure (GEX):
1. Left Chart
Ticker: Nasdaq 100 Index (
NDX )Gamma Exposure: 0DTE (expiration: May 14, 2026)
Time Trigger: Regular Trading Hours (RTH) opening
Target: The largest 0DTE GEX level at 29,660, which tends to act as a magnet price level.
2. Right Chart
Ticker: Volatility Index (
VIX )Gamma Exposure: Nearest expiration (May 19, 2026)
Pattern: A false breakout in
VIX above the largest GEX level (18), while at the same time NDX begins moving toward its intraday target.I see this pattern occur very frequently. I focus on identifying the largest 0DTE GEX level in a major asset such as
SPX , SPY , NDX , or QQQ , and then look for confirmation from the opposite move in VIX .As Linda Raschke said:
“All you need is one pattern to make a living.”

면책사항
해당 정보와 게시물은 금융, 투자, 트레이딩 또는 기타 유형의 조언이나 권장 사항으로 간주되지 않으며, 트레이딩뷰에서 제공하거나 보증하는 것이 아닙니다. 자세한 내용은 이용 약관을 참조하세요.
면책사항
해당 정보와 게시물은 금융, 투자, 트레이딩 또는 기타 유형의 조언이나 권장 사항으로 간주되지 않으며, 트레이딩뷰에서 제공하거나 보증하는 것이 아닙니다. 자세한 내용은 이용 약관을 참조하세요.