
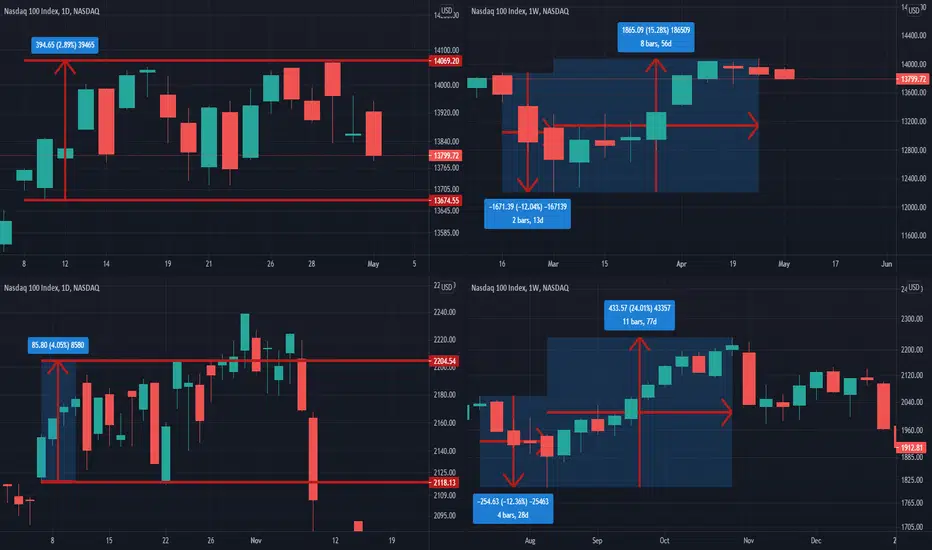
Above charts: daily chart since April 9th 2021and weekly chart since mid-February 2021.
Below cheats: daily chart since October 5th, 2007 and weekly chart since July 2007. (just before market crash)
I think these chart patterns have lots of similarities, you may argue that, but always it is better to be cautious.
If a similar scenario happening in the coming days, do you have a plan for that?
Below cheats: daily chart since October 5th, 2007 and weekly chart since July 2007. (just before market crash)
I think these chart patterns have lots of similarities, you may argue that, but always it is better to be cautious.
If a similar scenario happening in the coming days, do you have a plan for that?

Use the following link to access trading ideas: patreon.com/SniperTraderStocks?utm_medium=unknown&utm_source=join_link&utm_campaign=creatorshare_creator&utm_content=copyLink
면책사항
해당 정보와 게시물은 금융, 투자, 트레이딩 또는 기타 유형의 조언이나 권장 사항으로 간주되지 않으며, 트레이딩뷰에서 제공하거나 보증하는 것이 아닙니다. 자세한 내용은 이용 약관을 참조하세요.
Use the following link to access trading ideas: patreon.com/SniperTraderStocks?utm_medium=unknown&utm_source=join_link&utm_campaign=creatorshare_creator&utm_content=copyLink
면책사항
해당 정보와 게시물은 금융, 투자, 트레이딩 또는 기타 유형의 조언이나 권장 사항으로 간주되지 않으며, 트레이딩뷰에서 제공하거나 보증하는 것이 아닙니다. 자세한 내용은 이용 약관을 참조하세요.