
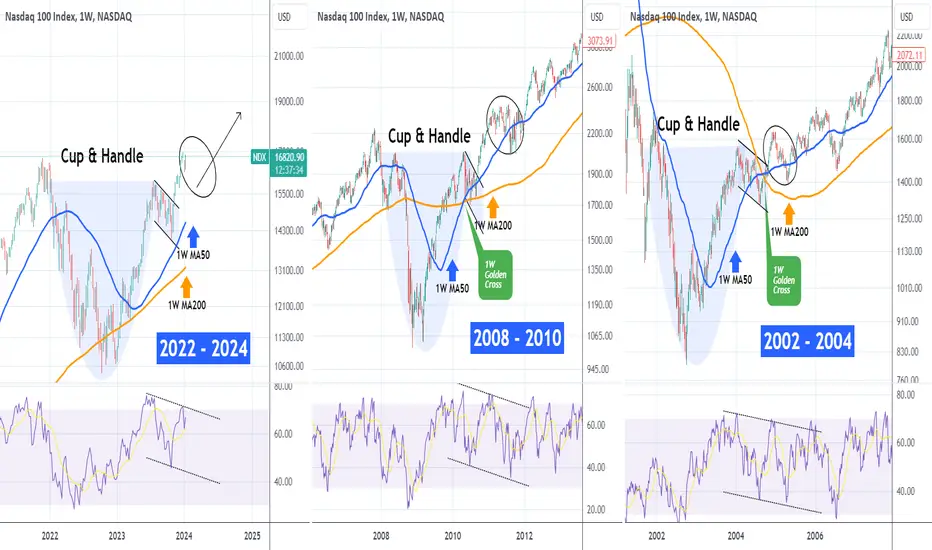
Nasdaq (NDX) has completed a giant Cup & Handle pattern and since the late October 2023 bottom, it has started the post Handle rally. This rally historically tends to be a very long-term one but with its fair share of corrections to at least the 1W MA50 (blue trend-line).
As you know 2022 was the year of the Inflation Crisis (left side of the Cup) while 2023 was its recovery (right side of Cup). Going back to the 2 most recent Bear Cycles, the 2008 Housing Crisis and 2002 Dotcom Crisis, we can observe similar Cup & Handle patterns, with identical 1W RSI sequences (oversold on their bottom and starting a Channel Down when the Handle begins).
The rally that followed after the Handle in 2011 and 2005 started another pull-back to the 1W MA50 (ellipse) just a few months after when the 1W RSI hit the top of its Channel Down. The chart shows that we might be in a similar situation right now. As a result, long-term investors may seek an additional buy entry as close to the 1W MA50 as possible like the late October bottom.
-------------------------------------------------------------------------------
** Please LIKE 👍, FOLLOW ✅, SHARE 🙌 and COMMENT ✍ if you enjoy this idea! Also share your ideas and charts in the comments section below! This is best way to keep it relevant, support us, keep the content here free and allow the idea to reach as many people as possible. **
-------------------------------------------------------------------------------
💸💸💸💸💸💸
👇 👇 👇 👇 👇 👇
As you know 2022 was the year of the Inflation Crisis (left side of the Cup) while 2023 was its recovery (right side of Cup). Going back to the 2 most recent Bear Cycles, the 2008 Housing Crisis and 2002 Dotcom Crisis, we can observe similar Cup & Handle patterns, with identical 1W RSI sequences (oversold on their bottom and starting a Channel Down when the Handle begins).
The rally that followed after the Handle in 2011 and 2005 started another pull-back to the 1W MA50 (ellipse) just a few months after when the 1W RSI hit the top of its Channel Down. The chart shows that we might be in a similar situation right now. As a result, long-term investors may seek an additional buy entry as close to the 1W MA50 as possible like the late October bottom.
-------------------------------------------------------------------------------
** Please LIKE 👍, FOLLOW ✅, SHARE 🙌 and COMMENT ✍ if you enjoy this idea! Also share your ideas and charts in the comments section below! This is best way to keep it relevant, support us, keep the content here free and allow the idea to reach as many people as possible. **
-------------------------------------------------------------------------------
💸💸💸💸💸💸
👇 👇 👇 👇 👇 👇

I trade Crypto, Forex, Indices & Commodities on PrimeXBT — all from one account with TradingView charts 👉 tradingshot.short.gy/PrimeXBT
I also use TradeNation for fixed spreads & zero commission 👉 tradingshot.short.gy/Tradenation
I also use TradeNation for fixed spreads & zero commission 👉 tradingshot.short.gy/Tradenation
면책사항
해당 정보와 게시물은 금융, 투자, 트레이딩 또는 기타 유형의 조언이나 권장 사항으로 간주되지 않으며, 트레이딩뷰에서 제공하거나 보증하는 것이 아닙니다. 자세한 내용은 이용 약관을 참조하세요.
I trade Crypto, Forex, Indices & Commodities on PrimeXBT — all from one account with TradingView charts 👉 tradingshot.short.gy/PrimeXBT
I also use TradeNation for fixed spreads & zero commission 👉 tradingshot.short.gy/Tradenation
I also use TradeNation for fixed spreads & zero commission 👉 tradingshot.short.gy/Tradenation
면책사항
해당 정보와 게시물은 금융, 투자, 트레이딩 또는 기타 유형의 조언이나 권장 사항으로 간주되지 않으며, 트레이딩뷰에서 제공하거나 보증하는 것이 아닙니다. 자세한 내용은 이용 약관을 참조하세요.