
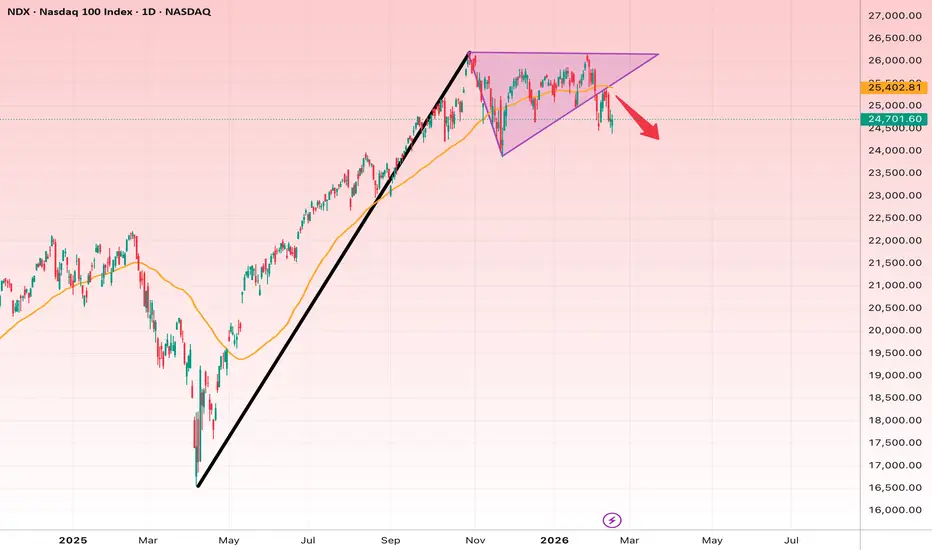
After a strong impulsive rally (black leg up), price entered a symmetrical triangle consolidation near highs.
Current price: ~24,700
Major resistance: ~26,000
Key support: ~24,300–24,500
This is a classic volatility compression before expansion setup.
🔎 Structure Breakdown
• Prior trend: Strong bullish impulse
• Current phase: Contracting triangle (lower highs + higher lows)
• Moving average flattening → momentum cooling
• Price currently near lower triangle boundary
Market is deciding whether this was:
• A bullish continuation pattern
or
• A distribution top
🟢 Bullish Scenario (Upside Breakout)
If:
• Daily close above 25,500
• Strong momentum through 26,000
Targets:
• 26,800
• 27,500
• Possible measured move toward 28,000
This would confirm continuation of the macro uptrend.
Long Invalidation:
• Close below 24,300
🔴 Bearish Scenario (Breakdown)
If:
• Clean break below 24,300
• Follow-through selling
Targets:
• 23,500
• 22,800
• Deeper correction toward 21,500
That would confirm a failed continuation and potential medium-term pullback.
Short Invalidation:
• Reclaim above 25,600
📊 Important Context
NDX is the driver of Big Tech:
• If it breaks down → META, MSFT, NFLX likely follow
• If it breaks up → broad tech expansion
This is a macro-level decision zone, not just a stock setup.
Current price: ~24,700
Major resistance: ~26,000
Key support: ~24,300–24,500
This is a classic volatility compression before expansion setup.
🔎 Structure Breakdown
• Prior trend: Strong bullish impulse
• Current phase: Contracting triangle (lower highs + higher lows)
• Moving average flattening → momentum cooling
• Price currently near lower triangle boundary
Market is deciding whether this was:
• A bullish continuation pattern
or
• A distribution top
🟢 Bullish Scenario (Upside Breakout)
If:
• Daily close above 25,500
• Strong momentum through 26,000
Targets:
• 26,800
• 27,500
• Possible measured move toward 28,000
This would confirm continuation of the macro uptrend.
Long Invalidation:
• Close below 24,300
🔴 Bearish Scenario (Breakdown)
If:
• Clean break below 24,300
• Follow-through selling
Targets:
• 23,500
• 22,800
• Deeper correction toward 21,500
That would confirm a failed continuation and potential medium-term pullback.
Short Invalidation:
• Reclaim above 25,600
📊 Important Context
NDX is the driver of Big Tech:
• If it breaks down → META, MSFT, NFLX likely follow
• If it breaks up → broad tech expansion
This is a macro-level decision zone, not just a stock setup.

면책사항
해당 정보와 게시물은 금융, 투자, 트레이딩 또는 기타 유형의 조언이나 권장 사항으로 간주되지 않으며, 트레이딩뷰에서 제공하거나 보증하는 것이 아닙니다. 자세한 내용은 이용 약관을 참조하세요.
면책사항
해당 정보와 게시물은 금융, 투자, 트레이딩 또는 기타 유형의 조언이나 권장 사항으로 간주되지 않으며, 트레이딩뷰에서 제공하거나 보증하는 것이 아닙니다. 자세한 내용은 이용 약관을 참조하세요.