
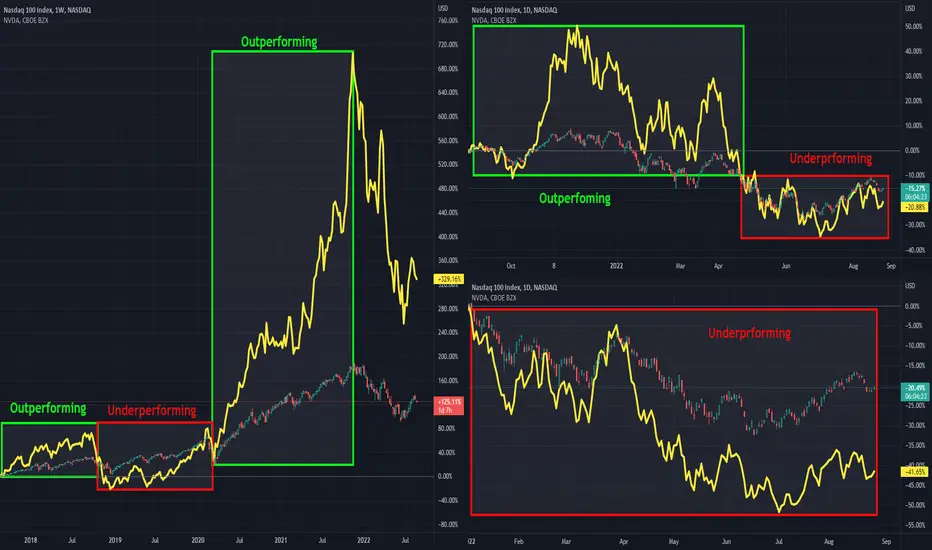
Wyckoff's stock selection process always included an analysis of comparative strength. To identify candidates for long positions, he looked for stocks or industries that were outperforming the market, both during trends and within trading ranges. In short positions, he looked for underperformers.
Therefore, he conducted his comparative strength analysis between a stock and the market, or between a stock and others in its industry.
Practical example: NASDAQ100 vs NVDA
5-year:

1-year:

YTD:

July-August 2022:

Conclusion: we can use outperforming stocks' charts with higher positive correlation as a leading indicator for Indexes!
Best,
Therefore, he conducted his comparative strength analysis between a stock and the market, or between a stock and others in its industry.
Practical example: NASDAQ100 vs NVDA
5-year:
1-year:
YTD:
July-August 2022:
Conclusion: we can use outperforming stocks' charts with higher positive correlation as a leading indicator for Indexes!
Best,

Use the following link to access trading ideas: patreon.com/SniperTraderStocks?utm_medium=unknown&utm_source=join_link&utm_campaign=creatorshare_creator&utm_content=copyLink
면책사항
해당 정보와 게시물은 금융, 투자, 트레이딩 또는 기타 유형의 조언이나 권장 사항으로 간주되지 않으며, 트레이딩뷰에서 제공하거나 보증하는 것이 아닙니다. 자세한 내용은 이용 약관을 참조하세요.
Use the following link to access trading ideas: patreon.com/SniperTraderStocks?utm_medium=unknown&utm_source=join_link&utm_campaign=creatorshare_creator&utm_content=copyLink
면책사항
해당 정보와 게시물은 금융, 투자, 트레이딩 또는 기타 유형의 조언이나 권장 사항으로 간주되지 않으며, 트레이딩뷰에서 제공하거나 보증하는 것이 아닙니다. 자세한 내용은 이용 약관을 참조하세요.