
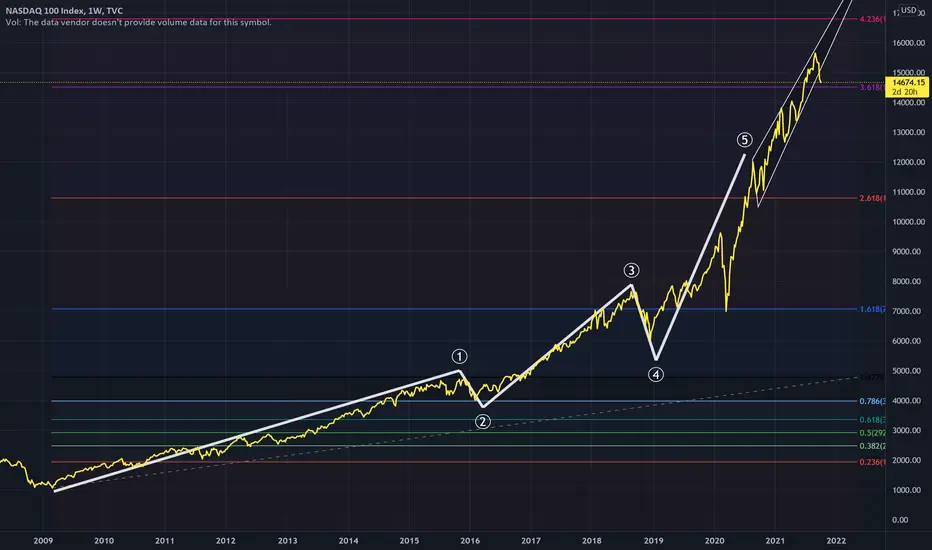
It doesn't get more obvious than this. We're probably headed back to 12k at the very least on a corrective wave. Fed GDP forecasts are really all you need to see to know lots of rate hikes and taxes coming soon. It's halving every year, and that's an optimistic estimate. Don't wanna spook the market. fred.stlouisfed.org/series/GDPC1CTM
노트
I'm gonna be looking for behavior near these key lvls in white, 14710/14660/14580. Ultimately bottom of the 1 yr bull trend (white channel, 14500ish) gonna get tested and quite possibly much lower over the next couple years. 노트
a closer look at EDT 노트
or maybe more like this? But if it turns and starts breaking the fib fan levels abandon ship.
노트
It's not over, look at that perfect rising wedge for 2nd leg노트
Updated, looks like 9-10k bottom of ABC on Macro. Notice the 5 wave started around 1k. Next one starts around 10k, then the one after that starts at 100k, but I prolly won't be alive to see it. Going up in magnitudes, exponential. 노트
Close up of the rising wedge 
면책사항
해당 정보와 게시물은 금융, 투자, 트레이딩 또는 기타 유형의 조언이나 권장 사항으로 간주되지 않으며, 트레이딩뷰에서 제공하거나 보증하는 것이 아닙니다. 자세한 내용은 이용 약관을 참조하세요.
면책사항
해당 정보와 게시물은 금융, 투자, 트레이딩 또는 기타 유형의 조언이나 권장 사항으로 간주되지 않으며, 트레이딩뷰에서 제공하거나 보증하는 것이 아닙니다. 자세한 내용은 이용 약관을 참조하세요.