
It would be better to use weekly charts for long-term analysis!
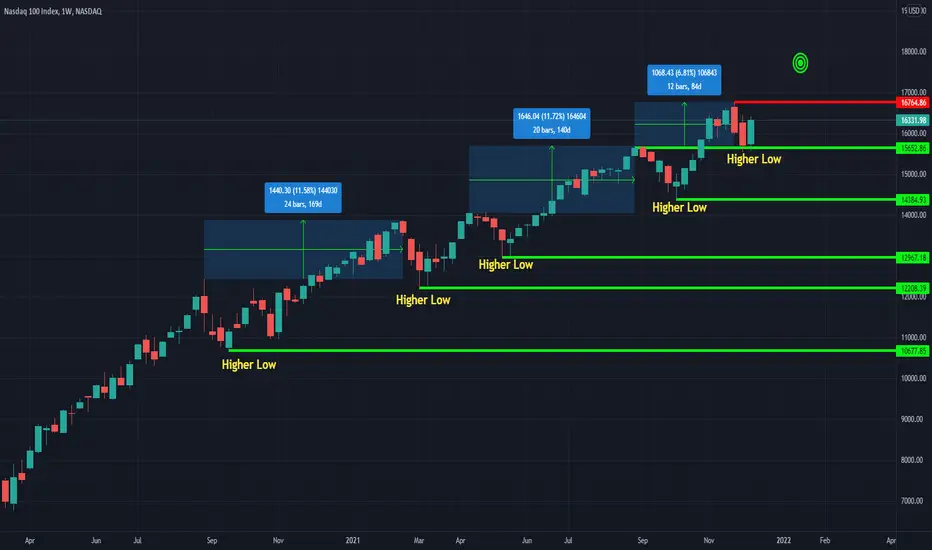
Trend: Bullish +141% gain in the past 89 weeks!

Bullish Runs: 6x, gain 15-83%, Duration: 6-23 weeks

Corrections: 6 times, -7.29 - 14.16%, Duration: 2-4 weeks!

Now let's compare the distance between new and previous pivot highs!
In the past4 times anytime NDX passed above the previous pivot high moves between +6.8-11.7%, duration: 11-24 weeks!

My observation:
Looking closer at the above phenomenon, we see last time NDX has closed 6.8% above the previous pivot high, which was much lower than 11.5 and 11.7 % in the previous advancement!
Having said that, the next pivot high for NDX in a Bullish case could be =<6.8% above the last pivot high.
If NDX closed above the previous pivot high in the coming week, the target could be 18000 in the following weeks!
Since the market has not made a Lower Low pattern in the last 89 weeks, closing below 15543.31 must be considered an alarming sign if happens!
You can see the most important support (green lines) and resistance (red lines) to watch in the coming days in these charts!
Best,
Moshkelgosha
DISCLAIMER
I’m not a certified financial planner/advisor, a certified financial analyst, an economist, a CPA, an accountant, or a lawyer. I’m not a finance professional through formal education. The contents on this site are for informational purposes only and do not constitute financial, accounting, or legal advice. I can’t promise that the information shared on my posts is appropriate for you or anyone else. By using this site, you agree to hold me harmless from any ramifications, financial or otherwise, that occur to you as a result of acting on information found on this site.
Trend: Bullish +141% gain in the past 89 weeks!
Bullish Runs: 6x, gain 15-83%, Duration: 6-23 weeks
Corrections: 6 times, -7.29 - 14.16%, Duration: 2-4 weeks!
Now let's compare the distance between new and previous pivot highs!
In the past4 times anytime NDX passed above the previous pivot high moves between +6.8-11.7%, duration: 11-24 weeks!
My observation:
Looking closer at the above phenomenon, we see last time NDX has closed 6.8% above the previous pivot high, which was much lower than 11.5 and 11.7 % in the previous advancement!
Having said that, the next pivot high for NDX in a Bullish case could be =<6.8% above the last pivot high.
If NDX closed above the previous pivot high in the coming week, the target could be 18000 in the following weeks!
Since the market has not made a Lower Low pattern in the last 89 weeks, closing below 15543.31 must be considered an alarming sign if happens!
You can see the most important support (green lines) and resistance (red lines) to watch in the coming days in these charts!
Best,
Moshkelgosha
DISCLAIMER
I’m not a certified financial planner/advisor, a certified financial analyst, an economist, a CPA, an accountant, or a lawyer. I’m not a finance professional through formal education. The contents on this site are for informational purposes only and do not constitute financial, accounting, or legal advice. I can’t promise that the information shared on my posts is appropriate for you or anyone else. By using this site, you agree to hold me harmless from any ramifications, financial or otherwise, that occur to you as a result of acting on information found on this site.

Use the following link to access trading ideas: patreon.com/SniperTraderStocks?utm_medium=unknown&utm_source=join_link&utm_campaign=creatorshare_creator&utm_content=copyLink
면책사항
해당 정보와 게시물은 금융, 투자, 트레이딩 또는 기타 유형의 조언이나 권장 사항으로 간주되지 않으며, 트레이딩뷰에서 제공하거나 보증하는 것이 아닙니다. 자세한 내용은 이용 약관을 참조하세요.
Use the following link to access trading ideas: patreon.com/SniperTraderStocks?utm_medium=unknown&utm_source=join_link&utm_campaign=creatorshare_creator&utm_content=copyLink
면책사항
해당 정보와 게시물은 금융, 투자, 트레이딩 또는 기타 유형의 조언이나 권장 사항으로 간주되지 않으며, 트레이딩뷰에서 제공하거나 보증하는 것이 아닙니다. 자세한 내용은 이용 약관을 참조하세요.