
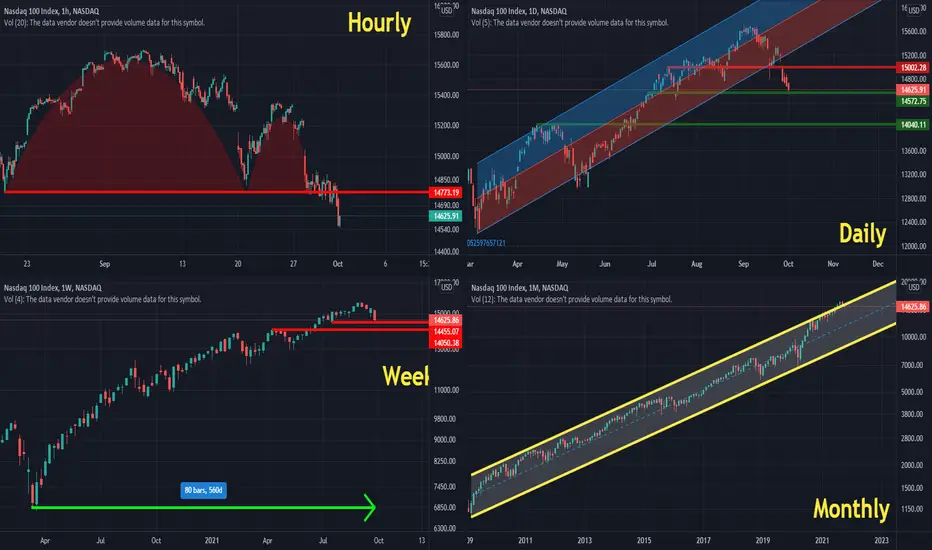
Hourly Chart: Reverse cup and handle pattern (Bearish)
Daily Chart: getting out of Bullish regression Channel and Higher-high higher-low pattern(Bearish)
Weekly Chart: Closing at lower levels for 4 weeks in a row for the first time in the past 80 weeks! (Bearish)
Monthly Chart: September was the Biggest monthly negative candle (-5.73%) in the past 18 months! (Bearish)
Conclusion: I believe this could continue for the next 2-3 weeks and we may find a support level near 14050 level.
Being patient in a market like this will pay off and provide good opportunities, however, you should not forget the best friend you have in the market is your "Stop Loss".
Daily Chart: getting out of Bullish regression Channel and Higher-high higher-low pattern(Bearish)
Weekly Chart: Closing at lower levels for 4 weeks in a row for the first time in the past 80 weeks! (Bearish)
Monthly Chart: September was the Biggest monthly negative candle (-5.73%) in the past 18 months! (Bearish)
Conclusion: I believe this could continue for the next 2-3 weeks and we may find a support level near 14050 level.
Being patient in a market like this will pay off and provide good opportunities, however, you should not forget the best friend you have in the market is your "Stop Loss".

Use the following link to access trading ideas: patreon.com/SniperTraderStocks?utm_medium=unknown&utm_source=join_link&utm_campaign=creatorshare_creator&utm_content=copyLink
면책사항
해당 정보와 게시물은 금융, 투자, 트레이딩 또는 기타 유형의 조언이나 권장 사항으로 간주되지 않으며, 트레이딩뷰에서 제공하거나 보증하는 것이 아닙니다. 자세한 내용은 이용 약관을 참조하세요.
Use the following link to access trading ideas: patreon.com/SniperTraderStocks?utm_medium=unknown&utm_source=join_link&utm_campaign=creatorshare_creator&utm_content=copyLink
면책사항
해당 정보와 게시물은 금융, 투자, 트레이딩 또는 기타 유형의 조언이나 권장 사항으로 간주되지 않으며, 트레이딩뷰에서 제공하거나 보증하는 것이 아닙니다. 자세한 내용은 이용 약관을 참조하세요.