
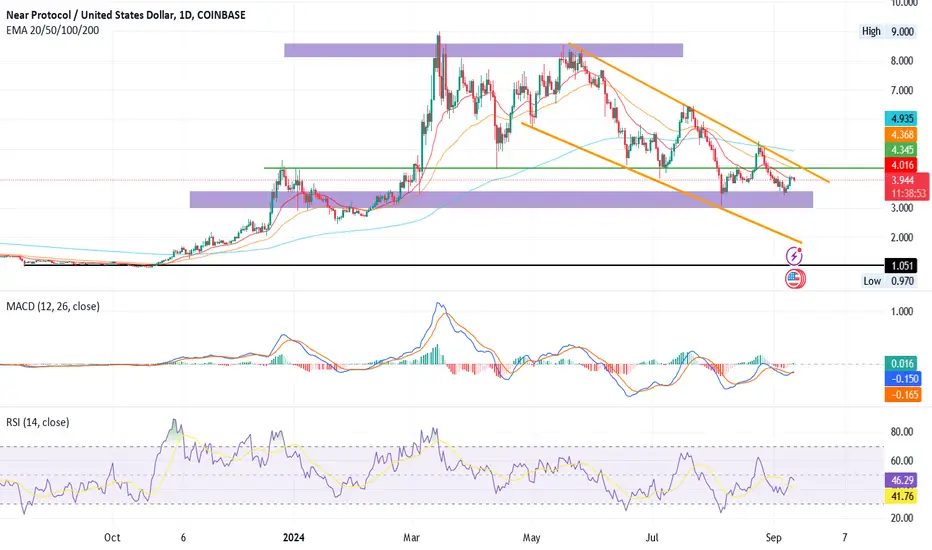
The daily chart for NEAR Protocol reveals a declining channel pattern, with the price fluctuating between the upper and lower boundaries.
NEAR's price remained range-bound throughout August, with $3.25 as support and $5 as resistance.
On the upside, there is potential for the price to reach the $7.5 level, which marks the channel’s upper boundary. But this would require a breakout above the psychological $5 level.
Currently, the long-term trend appears bearish, posing challenges for NEAR bulls. The price is trading below key Exponential Moving Averages (20, 50, and 200 days), indicating a weak trend and more favourable conditions for sellers.
If the price falls below the $3.25 level, it could signal a continuation of the bearish trend, potentially dragging the price down up to or beneath $3.
The RSI and the 14-day SMA are flat and below the mean line, suggesting a neutral to bearish short-term outlook. MACD is below the zero line, with a narrow histogram of 0.015, further indicating a bearish sentiment.
NEAR's price remained range-bound throughout August, with $3.25 as support and $5 as resistance.
On the upside, there is potential for the price to reach the $7.5 level, which marks the channel’s upper boundary. But this would require a breakout above the psychological $5 level.
Currently, the long-term trend appears bearish, posing challenges for NEAR bulls. The price is trading below key Exponential Moving Averages (20, 50, and 200 days), indicating a weak trend and more favourable conditions for sellers.
If the price falls below the $3.25 level, it could signal a continuation of the bearish trend, potentially dragging the price down up to or beneath $3.
The RSI and the 14-day SMA are flat and below the mean line, suggesting a neutral to bearish short-term outlook. MACD is below the zero line, with a narrow histogram of 0.015, further indicating a bearish sentiment.

면책사항
해당 정보와 게시물은 금융, 투자, 트레이딩 또는 기타 유형의 조언이나 권장 사항으로 간주되지 않으며, 트레이딩뷰에서 제공하거나 보증하는 것이 아닙니다. 자세한 내용은 이용 약관을 참조하세요.
면책사항
해당 정보와 게시물은 금융, 투자, 트레이딩 또는 기타 유형의 조언이나 권장 사항으로 간주되지 않으며, 트레이딩뷰에서 제공하거나 보증하는 것이 아닙니다. 자세한 내용은 이용 약관을 참조하세요.