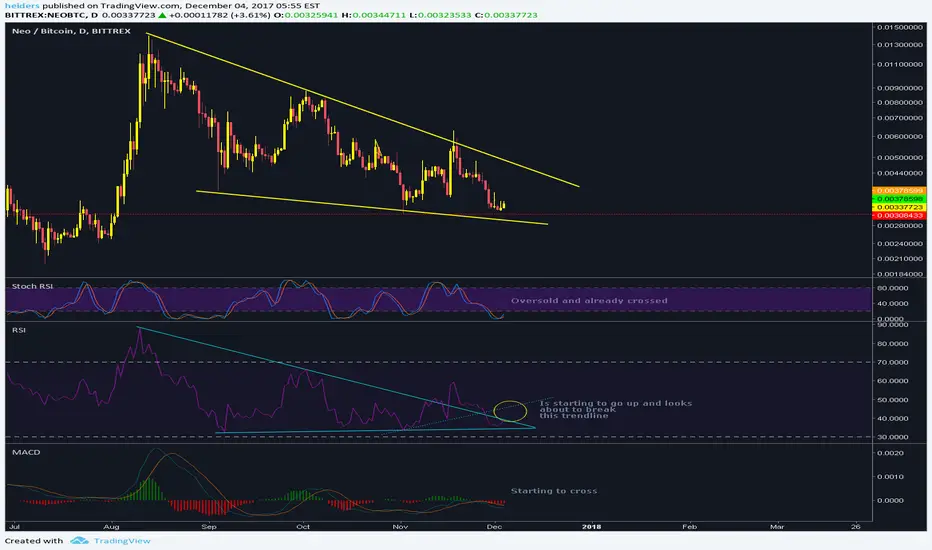
NEO has been in a downtrend since mid August. After a failed swing that could not break the upper trendline and a deep retracement, the indicators again show a positive future for NEO. The Stochastic RSI shows that NEO is oversold on the daily chart has already crossed. Similarly, the RSI is also going up again and seems to be breaking a long term trendline on this chart. It did so as well on the previous swing, but failed to continue at that point and returned in the channel. The MACD seems ready to cross and turn green also. So it looks lik eeverything is lining up again for a nice move up. But NEO is quite fickle and can't always be predicted so easily, so we will have to see. I have added some o my position here and will buy more only after a confirmation of a good move upwards.
액티브 트레이드
Worked out very well so far. NEO seems to be in this continuation pattern at the moment, which looks pretty bullish. 
관련 발행물
면책사항
해당 정보와 게시물은 금융, 투자, 트레이딩 또는 기타 유형의 조언이나 권장 사항으로 간주되지 않으며, 트레이딩뷰에서 제공하거나 보증하는 것이 아닙니다. 자세한 내용은 이용 약관을 참조하세요.
면책사항
해당 정보와 게시물은 금융, 투자, 트레이딩 또는 기타 유형의 조언이나 권장 사항으로 간주되지 않으며, 트레이딩뷰에서 제공하거나 보증하는 것이 아닙니다. 자세한 내용은 이용 약관을 참조하세요.