롱
NEOUSD 4h long setup
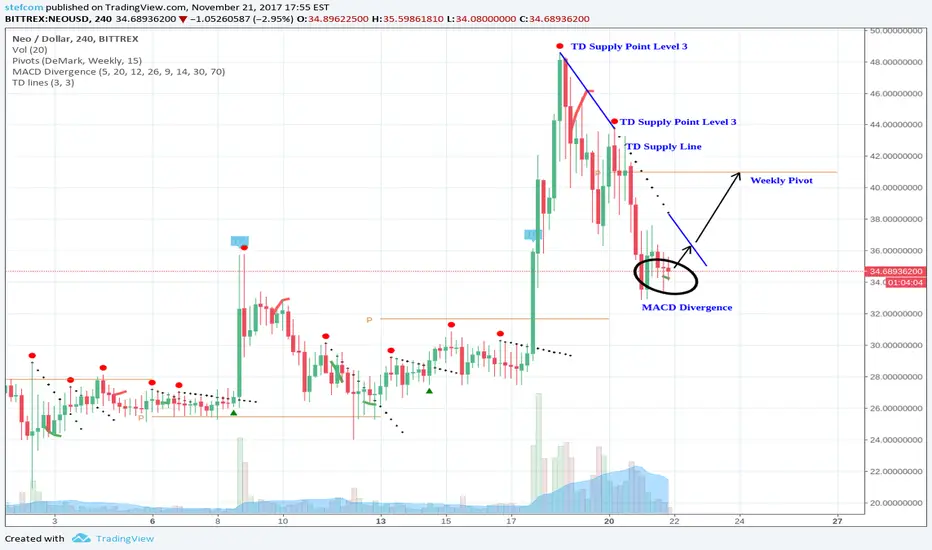
The NEOUSD 4h chart shows a Divergence of Price vs the MACD histogram.
The divergence appeared below a TD Supply Line and could indicate a trend-reversal.
When price breaks the TD Supply Line it could go up to the weekly pivot.
The divergence appeared below a TD Supply Line and could indicate a trend-reversal.
When price breaks the TD Supply Line it could go up to the weekly pivot.

⚡ Signals & Indicator & Strategy & Daily/ Weekly VIP Briefings: tradingclue.com/
⚡ GET THE CCIDivergence INDICATOR FOR FREE: bit.ly/FreeTradingViewIndicator
⚡ FREE Daily Briefings via Telegram: t.me/TradingClueBriefings
⚡ GET THE CCIDivergence INDICATOR FOR FREE: bit.ly/FreeTradingViewIndicator
⚡ FREE Daily Briefings via Telegram: t.me/TradingClueBriefings
관련 발행물
면책사항
해당 정보와 게시물은 금융, 투자, 트레이딩 또는 기타 유형의 조언이나 권장 사항으로 간주되지 않으며, 트레이딩뷰에서 제공하거나 보증하는 것이 아닙니다. 자세한 내용은 이용 약관을 참조하세요.