
Working with angles is something I see myself doing more often lately, meaning they have proven some reliability to me over time. When exactly is still quite intuitive and this publication is also an idea to further explore by other traders and so develop a competitive edge, and therefore should remain secret how to apply in further detail.
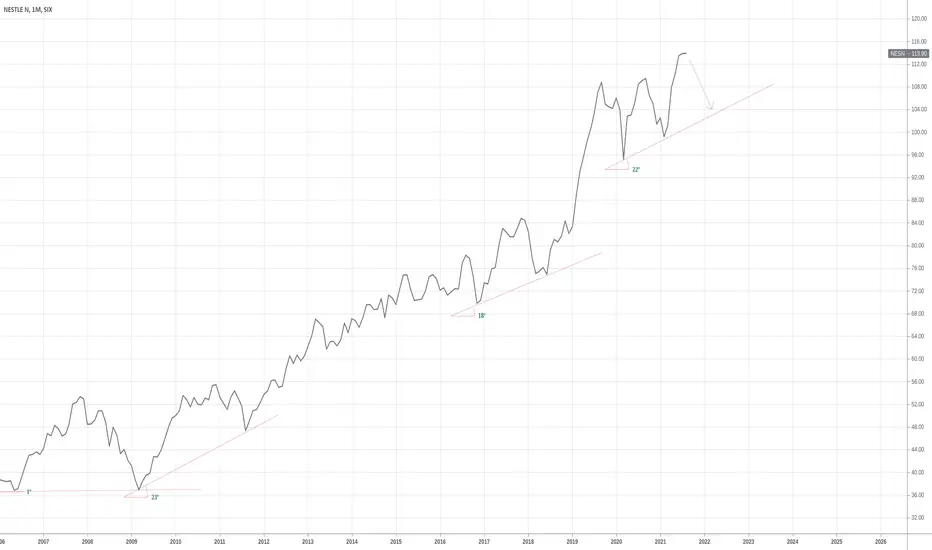
Here I look at Swiss company Nestle which always has been a high performer, at least since last recession. It price made a double bottom over the course of 2006-2009 with a top in December 2007.
From that 2009 onwards it delivers a good opportunity for bullish investors. When I see it touching an imaginary trendline I draw a line using the "Trend Angle" drawing tool. Often I discover that certain angles persist although with an offset up or down in price. Here I have drawn a 23 and 22 degree trendline with almost 10 years between them.
Long persistent trend angles objectively tell me something about strength and trend line reliability. For example, it would add weight to my decision for going short or long at this point in time.
Not saying I would go short here. This is where you can add your variables to make your own decision as a trader.
Here I look at Swiss company Nestle which always has been a high performer, at least since last recession. It price made a double bottom over the course of 2006-2009 with a top in December 2007.
From that 2009 onwards it delivers a good opportunity for bullish investors. When I see it touching an imaginary trendline I draw a line using the "Trend Angle" drawing tool. Often I discover that certain angles persist although with an offset up or down in price. Here I have drawn a 23 and 22 degree trendline with almost 10 years between them.
Long persistent trend angles objectively tell me something about strength and trend line reliability. For example, it would add weight to my decision for going short or long at this point in time.
Not saying I would go short here. This is where you can add your variables to make your own decision as a trader.
노트
Hourly tf looks like this btw, pretty bullish atm 
면책사항
해당 정보와 게시물은 금융, 투자, 트레이딩 또는 기타 유형의 조언이나 권장 사항으로 간주되지 않으며, 트레이딩뷰에서 제공하거나 보증하는 것이 아닙니다. 자세한 내용은 이용 약관을 참조하세요.
면책사항
해당 정보와 게시물은 금융, 투자, 트레이딩 또는 기타 유형의 조언이나 권장 사항으로 간주되지 않으며, 트레이딩뷰에서 제공하거나 보증하는 것이 아닙니다. 자세한 내용은 이용 약관을 참조하세요.