
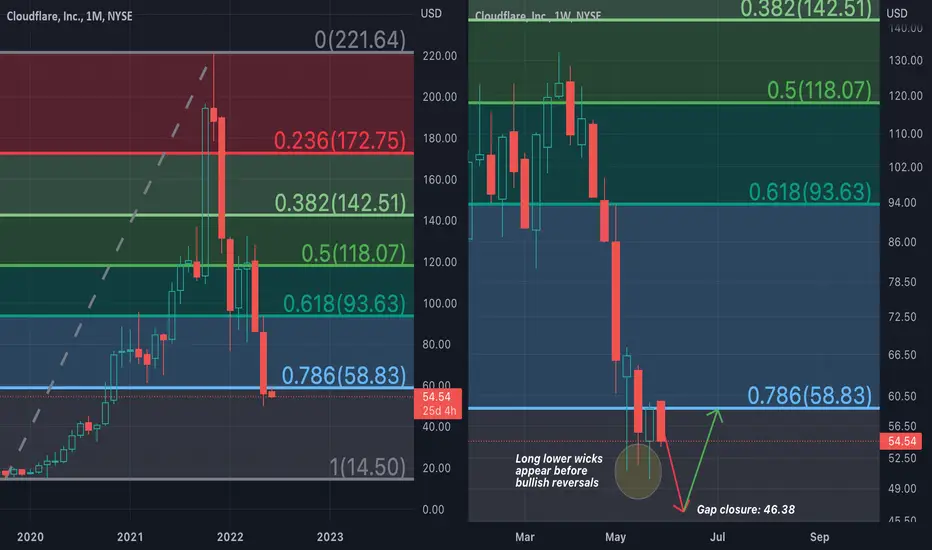
Chart analysis is showing that Cloudflare (NET) is trying to form a bottom at an important Fibonacci level. Currently, there is momentum to the downside on the daily chart and a gap to be closed at 46.38. It's therefore likely that with the downward momentum, NET will attempt to close this gap and then quickly rebound up to 59 as it will also try to maintain price at or above this level for the monthly close. The weekly charts are already showing bullish signs and the asset's underperformance relative to the S&P 500 has already slowed down, which virtually always occurs right before a reversal. The Wave Trend Oscillator by LazyBear shows that momentum to the downside on the highest timeframes is already bottomed and will soon start to revert back to the upside. On the daily chart, Heikin Ashi candles and Fibonacci Bollinger Bands also show signs of a bottoming pattern forming. The daily RSI has been showing bullish divergence since May. Therefore entering NET at prices around the gap closure at 46.38 could be a great risk-reward entry for long-term investors. Although anything is possible, it's statistically unlikely that NET will make a full retracement and fall much lower than the gap closure. In the years to come, Cloudflare will likely go to the moon.
Not financial advice.
Not financial advice.

면책사항
해당 정보와 게시물은 금융, 투자, 트레이딩 또는 기타 유형의 조언이나 권장 사항으로 간주되지 않으며, 트레이딩뷰에서 제공하거나 보증하는 것이 아닙니다. 자세한 내용은 이용 약관을 참조하세요.
면책사항
해당 정보와 게시물은 금융, 투자, 트레이딩 또는 기타 유형의 조언이나 권장 사항으로 간주되지 않으며, 트레이딩뷰에서 제공하거나 보증하는 것이 아닙니다. 자세한 내용은 이용 약관을 참조하세요.