
Technical Analysis Summary
Chart Type: Daily (1D)
Ticker: NFLX (Netflix Inc.)
Current Price: $1,194.00 (as of October 16, 2025)
Recent Movement: Down by -0.77%
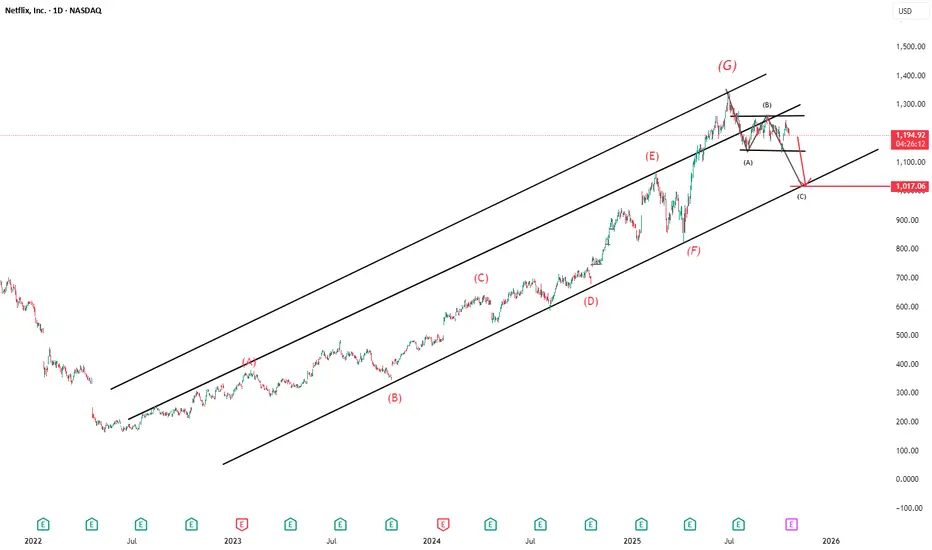
📈 Elliott Wave Labels (in red)
The stock shows a 7-wave impulse move labeled from (A) to (G), forming an upward channel.
The latest top is marked as (G) near $1,450.
A corrective structure appears to be forming post-(G), labeled as (A), (B), (C) in black.
📉 Bearish Outlook
The chart suggests a potential further decline:
From the current level ($1,194) to near $1,107 (short-term support).
Then possibly down to around $1,017 (marked as wave (C)).
📊 Trend Channels
Two parallel ascending channels:
The inner channel guided the move from early 2023 until mid-2025.
The outer channel includes the recent peak at (G), showing possible overextension.
The price has broken below the upper boundary, hinting at a trend change.
Chart Type: Daily (1D)
Ticker: NFLX (Netflix Inc.)
Current Price: $1,194.00 (as of October 16, 2025)
Recent Movement: Down by -0.77%
📈 Elliott Wave Labels (in red)
The stock shows a 7-wave impulse move labeled from (A) to (G), forming an upward channel.
The latest top is marked as (G) near $1,450.
A corrective structure appears to be forming post-(G), labeled as (A), (B), (C) in black.
📉 Bearish Outlook
The chart suggests a potential further decline:
From the current level ($1,194) to near $1,107 (short-term support).
Then possibly down to around $1,017 (marked as wave (C)).
📊 Trend Channels
Two parallel ascending channels:
The inner channel guided the move from early 2023 until mid-2025.
The outer channel includes the recent peak at (G), showing possible overextension.
The price has broken below the upper boundary, hinting at a trend change.

Technical Analyst BY Passion
면책사항
해당 정보와 게시물은 금융, 투자, 트레이딩 또는 기타 유형의 조언이나 권장 사항으로 간주되지 않으며, 트레이딩뷰에서 제공하거나 보증하는 것이 아닙니다. 자세한 내용은 이용 약관을 참조하세요.
Technical Analyst BY Passion
면책사항
해당 정보와 게시물은 금융, 투자, 트레이딩 또는 기타 유형의 조언이나 권장 사항으로 간주되지 않으며, 트레이딩뷰에서 제공하거나 보증하는 것이 아닙니다. 자세한 내용은 이용 약관을 참조하세요.