
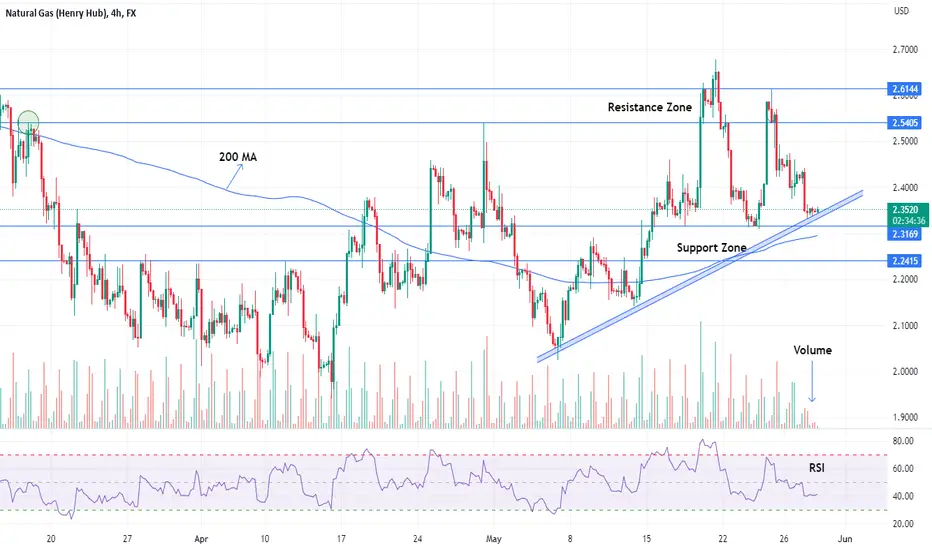
The NATURAL GAS trend is bearish for the last couple of months. The market placed a 1.9625 low on 22-Feb-2023. In a 4Hour time frame market reject the resistance area ( $2.54-2.61 ) as mentioned in the price chart and continued the bearish move. Now price is traded near the Support area ( $2.31-2.24 ). Volume indicates bears lose momentum. Price respect the Trendline in the past two times and now again near to test. Price also traded above the 200 MA ( moving average ) which indicates a bullish trend. So initiate long positions after closing above the Support area and also the trendline. On the other side, Short selling is favorable near the resistance area as mentioned above in the price chart after confirmation by a bearish price action structure.
Support and Resistance levels for day trading ;
Pivot Point Level: PP 2.3776
Support Levels: S1 2.3137, S2 2.2684, S3 2.2045
Resistance Levels: R1 2.4229, R2 2.4868, R3 2.5321
Support and Resistance levels for day trading ;
Pivot Point Level: PP 2.3776
Support Levels: S1 2.3137, S2 2.2684, S3 2.2045
Resistance Levels: R1 2.4229, R2 2.4868, R3 2.5321

면책사항
해당 정보와 게시물은 금융, 투자, 트레이딩 또는 기타 유형의 조언이나 권장 사항으로 간주되지 않으며, 트레이딩뷰에서 제공하거나 보증하는 것이 아닙니다. 자세한 내용은 이용 약관을 참조하세요.
면책사항
해당 정보와 게시물은 금융, 투자, 트레이딩 또는 기타 유형의 조언이나 권장 사항으로 간주되지 않으며, 트레이딩뷰에서 제공하거나 보증하는 것이 아닙니다. 자세한 내용은 이용 약관을 참조하세요.