
2008 vs 2020
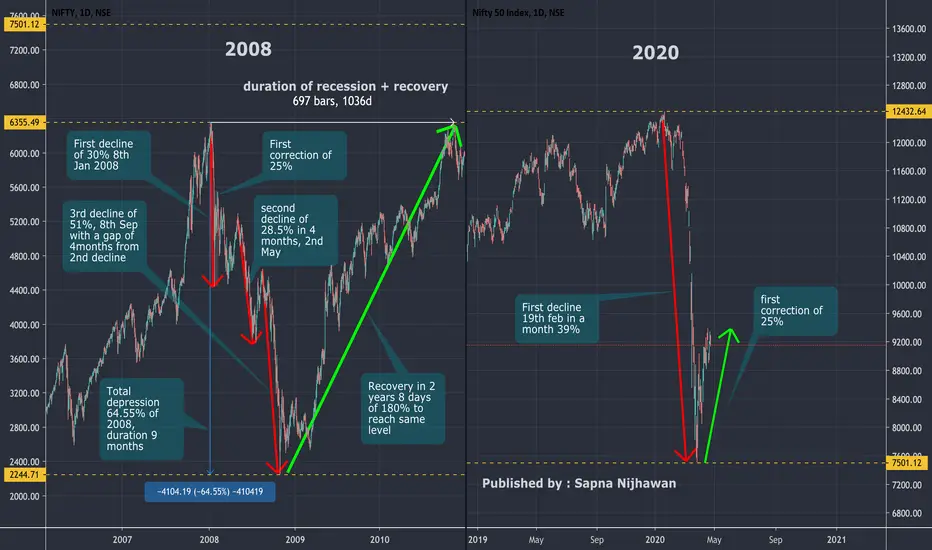
as we see similarities of first decline of -30% (2008) & -39% (2020)
and first correction of 25% in both 2008 and 2020 scenarios.
2008 2nd decline +4 months -28.5%
2008 3rd decline +4months - 51%
Total depression in 2008 was 64.55%
Depression will we see in 2020 should be should be above 60% too
bullish trend we are seeing in 2020 is just a correction
as we see similarities of first decline of -30% (2008) & -39% (2020)
and first correction of 25% in both 2008 and 2020 scenarios.
2008 2nd decline +4 months -28.5%
2008 3rd decline +4months - 51%
Total depression in 2008 was 64.55%
Depression will we see in 2020 should be should be above 60% too
bullish trend we are seeing in 2020 is just a correction
액티브 트레이드
Will we see 50-60% overall depression, making us on the level of 5000-6000?
면책사항
해당 정보와 게시물은 금융, 투자, 트레이딩 또는 기타 유형의 조언이나 권장 사항으로 간주되지 않으며, 트레이딩뷰에서 제공하거나 보증하는 것이 아닙니다. 자세한 내용은 이용 약관을 참조하세요.
면책사항
해당 정보와 게시물은 금융, 투자, 트레이딩 또는 기타 유형의 조언이나 권장 사항으로 간주되지 않으며, 트레이딩뷰에서 제공하거나 보증하는 것이 아닙니다. 자세한 내용은 이용 약관을 참조하세요.