
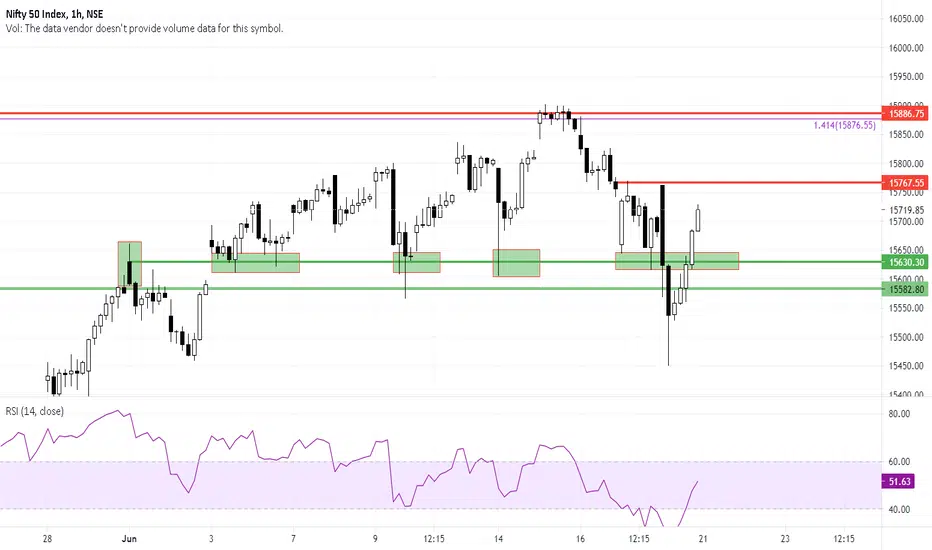
Nifty traded in a wide range of approx 300 points today.
Candle formed today is a Big range hammer candle.
Candles Structure is of lower low, lower high.
Gap resistance above hammer candle
Price support underneath hammer candle.
All above observations are somehow suggesting that the index might oscillate in a big range in the coming week, it might see selling at the upper range and buying at the lower end of the range.
Honestly, the trend is not at all clear in the index and it might witness wild fluctuation or could form a kind of complex price action, so I'll be avoiding trading in nifty, up till I see some clear price action developemnt.
Candle formed today is a Big range hammer candle.
Candles Structure is of lower low, lower high.
Gap resistance above hammer candle
Price support underneath hammer candle.
All above observations are somehow suggesting that the index might oscillate in a big range in the coming week, it might see selling at the upper range and buying at the lower end of the range.
Honestly, the trend is not at all clear in the index and it might witness wild fluctuation or could form a kind of complex price action, so I'll be avoiding trading in nifty, up till I see some clear price action developemnt.

면책사항
해당 정보와 게시물은 금융, 투자, 트레이딩 또는 기타 유형의 조언이나 권장 사항으로 간주되지 않으며, 트레이딩뷰에서 제공하거나 보증하는 것이 아닙니다. 자세한 내용은 이용 약관을 참조하세요.
면책사항
해당 정보와 게시물은 금융, 투자, 트레이딩 또는 기타 유형의 조언이나 권장 사항으로 간주되지 않으며, 트레이딩뷰에서 제공하거나 보증하는 것이 아닙니다. 자세한 내용은 이용 약관을 참조하세요.