
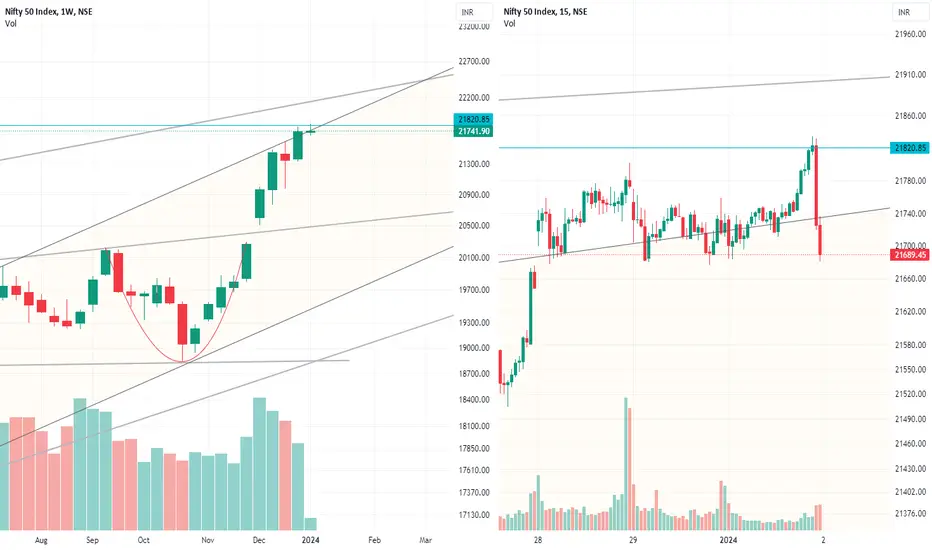
On Weekly Chart - After the Cup and Handle BO - Nifty retested the BO zone and bounced forming a Rounding Bottom BO. The Target for RB is 21820. The Multi-year trendline resistance is likely to cross around 21900-22000. Given India Vix BO, Nifty might face sharp correction after testing 21820-21900 levels. Keep a tab on individual stocks and their support levels
After reaching the Target of Rounding Bottom BO at 21,820 - Nifty faced with a Sharp Correction Precisely from the target level
This is the speciality of Technical Analysis. Technical Analysis is NOT based on Hope / Expectation / Trust on Management / Company / not a Future Forward state. A Chart Pattern is formed by "Herd Consensus" - How Majority People Behave, How Big Players / Operators create a situation of Demand / Panic Selling manipulating the minds of Majority Retailers.
Technical Analysis is simply a Scientific & Mathematical model of Human Behaviour and I see it as my Bhagavad Gita / Holy Bible / Quran. It already encompasses Hyped News messages from Media, Fraudulent attempts of some company management, Actions by Regulators, Company's product focus, future vision everything and is engraved in stone and hence cannot be changed.
This is why and how Technical Analysis works successfully
Disclaimer:
Stocks-n-Trends is NOT a SEBI registered company. We do not provide Buy / Sell recommendations - rather we provide detailed analysis of how to review a chart, explain multi--timeframe views purely for Educational Purposes. We strongly suggest our followers to "Learn to Ride the Tide" and consult your Financial Advisors before taking any positions.
If you like our detailed analysis, please do rate us with your Likes, Boost and share your comments
-Team Stocks-n-Trends
After reaching the Target of Rounding Bottom BO at 21,820 - Nifty faced with a Sharp Correction Precisely from the target level
This is the speciality of Technical Analysis. Technical Analysis is NOT based on Hope / Expectation / Trust on Management / Company / not a Future Forward state. A Chart Pattern is formed by "Herd Consensus" - How Majority People Behave, How Big Players / Operators create a situation of Demand / Panic Selling manipulating the minds of Majority Retailers.
Technical Analysis is simply a Scientific & Mathematical model of Human Behaviour and I see it as my Bhagavad Gita / Holy Bible / Quran. It already encompasses Hyped News messages from Media, Fraudulent attempts of some company management, Actions by Regulators, Company's product focus, future vision everything and is engraved in stone and hence cannot be changed.
This is why and how Technical Analysis works successfully
Disclaimer:
Stocks-n-Trends is NOT a SEBI registered company. We do not provide Buy / Sell recommendations - rather we provide detailed analysis of how to review a chart, explain multi--timeframe views purely for Educational Purposes. We strongly suggest our followers to "Learn to Ride the Tide" and consult your Financial Advisors before taking any positions.
If you like our detailed analysis, please do rate us with your Likes, Boost and share your comments
-Team Stocks-n-Trends

- Team Stocks-n-Trends
- Telegram: telegram.me/stocksntrends
- Telegram: telegram.me/stocksntrends
관련 발행물
면책사항
해당 정보와 게시물은 금융, 투자, 트레이딩 또는 기타 유형의 조언이나 권장 사항으로 간주되지 않으며, 트레이딩뷰에서 제공하거나 보증하는 것이 아닙니다. 자세한 내용은 이용 약관을 참조하세요.
- Team Stocks-n-Trends
- Telegram: telegram.me/stocksntrends
- Telegram: telegram.me/stocksntrends
관련 발행물
면책사항
해당 정보와 게시물은 금융, 투자, 트레이딩 또는 기타 유형의 조언이나 권장 사항으로 간주되지 않으며, 트레이딩뷰에서 제공하거나 보증하는 것이 아닙니다. 자세한 내용은 이용 약관을 참조하세요.