
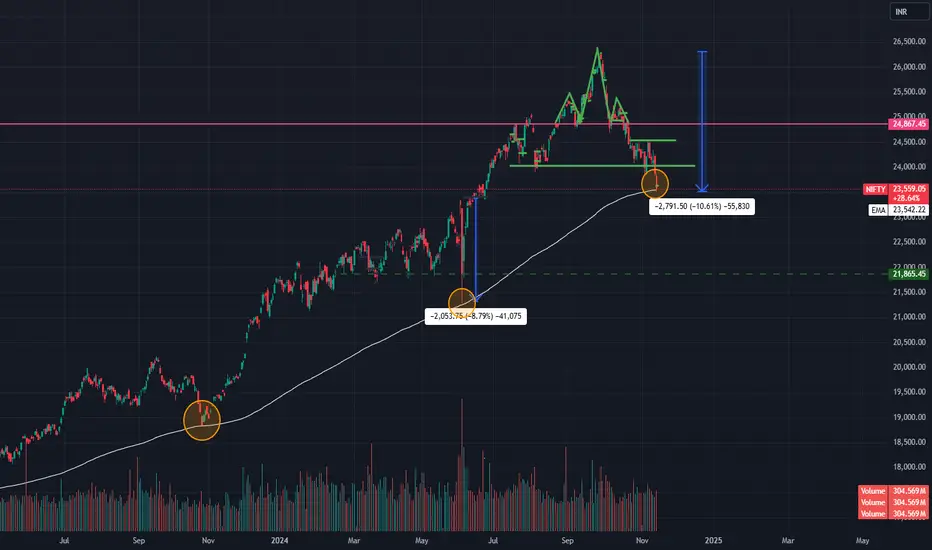
"In recent days, Nifty has formed a bearish head and shoulder pattern, indicating potential downside. It has currently reached 26,277.34, which is approximately 10.50% below its previous high. The 23,500 level is a crucial support zone, coinciding with the 200-day Exponential Moving Average (EMA). Historically, Nifty has tended to bounce off this 200-EMA.
However, it's important to note that market sentiment has turned bearish. Therefore, a prudent strategy would be to adopt a cautious approach, considering selling into rallies until we receive clear signs of upward momentum."
However, it's important to note that market sentiment has turned bearish. Therefore, a prudent strategy would be to adopt a cautious approach, considering selling into rallies until we receive clear signs of upward momentum."

면책사항
해당 정보와 게시물은 금융, 투자, 트레이딩 또는 기타 유형의 조언이나 권장 사항으로 간주되지 않으며, 트레이딩뷰에서 제공하거나 보증하는 것이 아닙니다. 자세한 내용은 이용 약관을 참조하세요.
면책사항
해당 정보와 게시물은 금융, 투자, 트레이딩 또는 기타 유형의 조언이나 권장 사항으로 간주되지 않으며, 트레이딩뷰에서 제공하거나 보증하는 것이 아닙니다. 자세한 내용은 이용 약관을 참조하세요.