
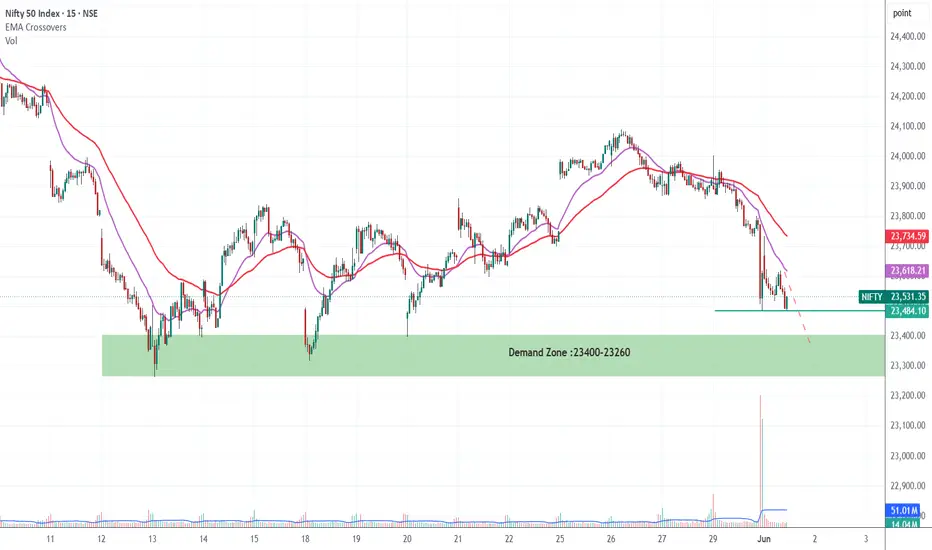
NIFTY is showing weakness on the 15-minute chart, hourly chart even daily chart as price continues trading below both EMAs, indicating bearish momentum. A sharp breakdown with strong volume confirms seller dominance, while the 23400–23260 demand zone is now the key area to watch. If buyers defend this zone, a short-term bounce is possible, but a breakdown below it may trigger further downside pressure.
액티브 트레이드
Now Nifty Entered into Demand Zone, it may remain Sidways for sometime거래청산: 타겟 닿음

면책사항
해당 정보와 게시물은 금융, 투자, 트레이딩 또는 기타 유형의 조언이나 권장 사항으로 간주되지 않으며, 트레이딩뷰에서 제공하거나 보증하는 것이 아닙니다. 자세한 내용은 이용 약관을 참조하세요.
면책사항
해당 정보와 게시물은 금융, 투자, 트레이딩 또는 기타 유형의 조언이나 권장 사항으로 간주되지 않으며, 트레이딩뷰에서 제공하거나 보증하는 것이 아닙니다. 자세한 내용은 이용 약관을 참조하세요.