 NIFTY
Current Market Structure
Spot Level
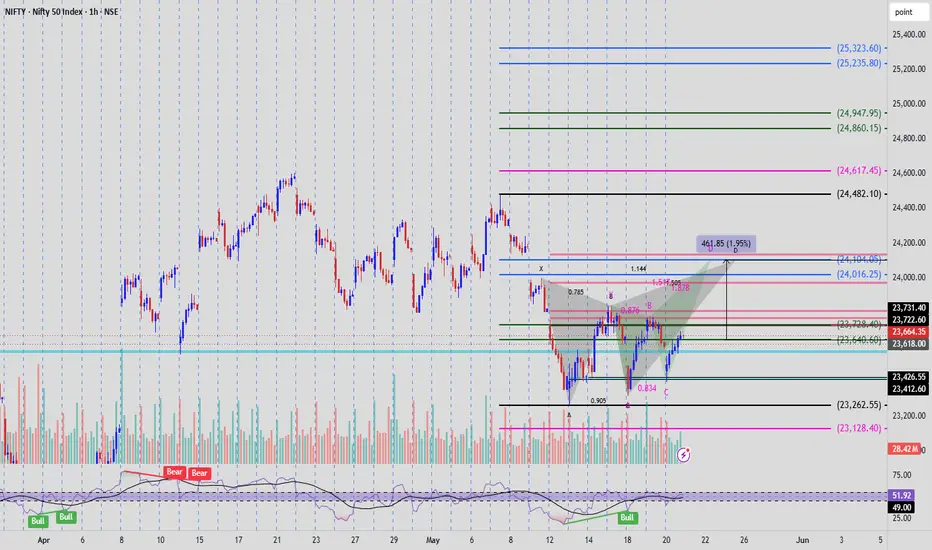
NIFTY Close: 23,664.35
RSI (14): 62.27 (bullish momentum) - 5M Chart
Price is trading above short-term support and recovering from point C.
Support Zones
23,640
23,618
23,462
23,262 (major swing support)
Resistance Zones
23,728 – 23,800
24,016
24,104 (Pattern D / final target)
24,482 (higher breakout target)
Harmonic Projection
The green projection indicates price moving from the current region toward point D.
Expected Upside
Current Price: 23,664
Target D: 24,104
Projected Gain: ≈ 462 points (+1.95%)
Trading Interpretation
Bullish Scenario
If NIFTY sustains above 23,640–23,618, the harmonic setup remains valid and price can advance toward:
23,800
24,016
24,104 (Primary Harmonic Target)
Invalidation
A decisive break below 23,618 weakens the structure.
A fall below 23,462 would invalidate the bullish setup.
RSI Confirmation
Current RSI above 50
Recent bullish crossover
Positive momentum building
This supports the bullish harmonic thesis.
액티브 트레이드
We were able to capture all 450 points from our entry levels. Trade done. Next will be from 23,700 to 24,200

면책사항
해당 정보와 게시물은 금융, 투자, 트레이딩 또는 기타 유형의 조언이나 권장 사항으로 간주되지 않으며, 트레이딩뷰에서 제공하거나 보증하는 것이 아닙니다. 자세한 내용은 이용 약관을 참조하세요.
면책사항
해당 정보와 게시물은 금융, 투자, 트레이딩 또는 기타 유형의 조언이나 권장 사항으로 간주되지 않으며, 트레이딩뷰에서 제공하거나 보증하는 것이 아닙니다. 자세한 내용은 이용 약관을 참조하세요.