
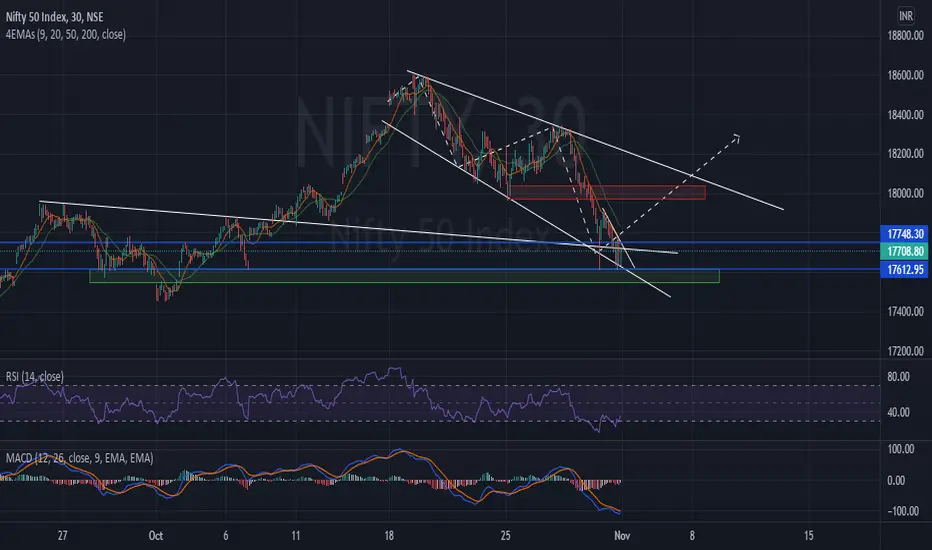
The Chart is self explanatory by itself.
Green rectangle - Demand Zone
Red rectangle - Supply Zone
Space between the two blue lines will be considered as no trading zone by me.
Please LIKE,COMMENT and SHARE the idea to keep me motivated so I can keep on further analysing potential Indices and stock trades for you.
Green rectangle - Demand Zone
Red rectangle - Supply Zone
Space between the two blue lines will be considered as no trading zone by me.
Please LIKE,COMMENT and SHARE the idea to keep me motivated so I can keep on further analysing potential Indices and stock trades for you.
액티브 트레이드
So as given in the analysis nifty showed a good move toward the upper side till it reached the resistance level already drawn. The trade is working perfectly and we made a really good profit in ce side.People can book here or hold as per their risk appetite.
Next will be trying to buy more on slight retracement if there is any.
Godspeed.
거래청산: 타겟 닿음
Target reached거래청산: 타겟 닿음
All targets done brake-out given.Godspeed

관련 발행물
면책사항
해당 정보와 게시물은 금융, 투자, 트레이딩 또는 기타 유형의 조언이나 권장 사항으로 간주되지 않으며, 트레이딩뷰에서 제공하거나 보증하는 것이 아닙니다. 자세한 내용은 이용 약관을 참조하세요.
관련 발행물
면책사항
해당 정보와 게시물은 금융, 투자, 트레이딩 또는 기타 유형의 조언이나 권장 사항으로 간주되지 않으며, 트레이딩뷰에서 제공하거나 보증하는 것이 아닙니다. 자세한 내용은 이용 약관을 참조하세요.