
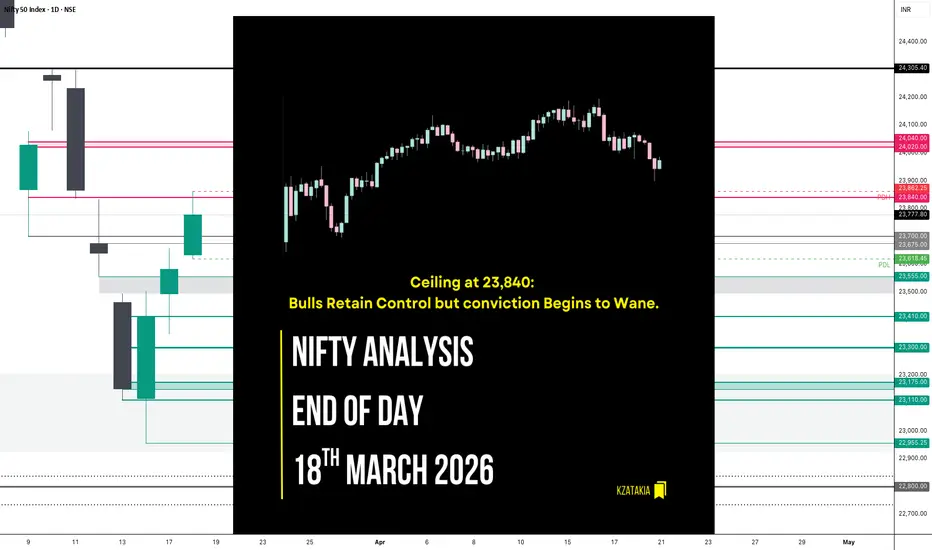
🟢 Nifty Analysis EOD – March 18, 2026 – Wednesday 🔴
Ceiling at 23,840: Bulls Retain Control but conviction Begins to Wane.
🗞 Nifty Summary
Following yesterday’s successful defense, Nifty opened with a confident 77-point Gap Up and quickly added another 105 points in the opening minutes. After a brief period of consolidation, a sharp dip found strong support at the Previous Day High (PDH), triggering a powerful 195-point V-shaped recovery that took the index to 23,835.
However, as noted in previous reports, the 23,840 level proved to be a formidable wall. Multiple attempts to breach this zone failed, signaling a lack of genuine bullish conviction at higher altitudes. Around 2:30 PM, the index broke its intraday trendline, sliding 131 points from the day’s high to close at 23,764.10 (Adjusted close: 23,777.80), gaining +196.65 points (+0.83%).
A key observation today was the erosion of the Nifty Futures premium by 2:20 PM, with futures trading almost at spot prices. This suggests that the immediate upside might be limited. While the day ended in the green, the structure suggests we might see a short-term pullback toward the 23,300 ~ 23,400 zone before the next leg of the rally.
🛡 5 Min Intraday Chart with Levels

📉 Daily Time Frame Chart with Intraday Levels

🕯 Daily Candle Breakdown
Open: 23,632.90
High: 23,862.25
Low: 23,618.45
Close: 23,777.80
Change: +196.65 (+0.83%)
🏗️ Structure Breakdown
Type: Bullish candle with a prominent upper wick.
Range: ≈ 244 points — high intraday volatility.
Body: ≈ 145 points — strong buying strength maintained from the opening gap.
Upper Wick: ≈ 84 points — clear resistance and rejection near the 23,840 barrier.
Lower Wick: ≈ 14 points — minimal selling pressure below the opening tick.
🛡 5 Min Intraday Chart

⚔️ Gladiator Strategy Update
ATR: 386.02
IB Range: 136.2 → Medium
Market Structure: Imbalanced
Trade Highlights:
09:56 Short Trade: Trailing SL Hit (Early rejection attempt).
10:50 Long Trade: Target Hit (R:R 1:1.4) (PDH Support + V-Recovery + IBH Breakout).
13:53 Long Trade: SL Hit (Caught in the 23,840 rejection).
Trade Summary: Today was a day of mixed results for me. I managed to catch the V-shaped recovery move at 10:50 AM after the index defended the PDH, which turned out to be a successful trade. However, trying to push for more near the 23,840 resistance resulted in a stop-loss as the bulls failed to sustain the breakout. It was a good lesson in respecting the overhead “supply wall.”
🧱 Support & Resistance Levels
Resistance Zones: 23,840 | 24,020 ~ 24,040 (Major Hurdle)
Support Zones: 23,618 (Today’s Low) | 23,555 | 23,410 | 23,300 | 23,175 ~ 23,150
🧠 Final Thoughts
“Bulls are still leading, but the air is getting thin.”
The failure to sustain above 23,840 and the vanishing futures premium are warning signs I cannot ignore.
While the trend remains bullish, the base-building process may require a healthy pullback to the 23,300 ~ 23,400 levels to invite fresh buyers.
For tomorrow, I will be watching the 23,840 zone very closely—a decisive close above it opens the doors to 24,000, but a failure there confirms the need for a retracement.
Stay alert and trade cautiously.
✏️ Disclaimer
This is my personal digital diary and represents my own analysis and point of view. It is not financial advice; please consult a professional advisor before making any trading decisions.
Ceiling at 23,840: Bulls Retain Control but conviction Begins to Wane.
🗞 Nifty Summary
Following yesterday’s successful defense, Nifty opened with a confident 77-point Gap Up and quickly added another 105 points in the opening minutes. After a brief period of consolidation, a sharp dip found strong support at the Previous Day High (PDH), triggering a powerful 195-point V-shaped recovery that took the index to 23,835.
However, as noted in previous reports, the 23,840 level proved to be a formidable wall. Multiple attempts to breach this zone failed, signaling a lack of genuine bullish conviction at higher altitudes. Around 2:30 PM, the index broke its intraday trendline, sliding 131 points from the day’s high to close at 23,764.10 (Adjusted close: 23,777.80), gaining +196.65 points (+0.83%).
A key observation today was the erosion of the Nifty Futures premium by 2:20 PM, with futures trading almost at spot prices. This suggests that the immediate upside might be limited. While the day ended in the green, the structure suggests we might see a short-term pullback toward the 23,300 ~ 23,400 zone before the next leg of the rally.
🛡 5 Min Intraday Chart with Levels
📉 Daily Time Frame Chart with Intraday Levels
🕯 Daily Candle Breakdown
Open: 23,632.90
High: 23,862.25
Low: 23,618.45
Close: 23,777.80
Change: +196.65 (+0.83%)
🏗️ Structure Breakdown
Type: Bullish candle with a prominent upper wick.
Range: ≈ 244 points — high intraday volatility.
Body: ≈ 145 points — strong buying strength maintained from the opening gap.
Upper Wick: ≈ 84 points — clear resistance and rejection near the 23,840 barrier.
Lower Wick: ≈ 14 points — minimal selling pressure below the opening tick.
🛡 5 Min Intraday Chart
⚔️ Gladiator Strategy Update
ATR: 386.02
IB Range: 136.2 → Medium
Market Structure: Imbalanced
Trade Highlights:
09:56 Short Trade: Trailing SL Hit (Early rejection attempt).
10:50 Long Trade: Target Hit (R:R 1:1.4) (PDH Support + V-Recovery + IBH Breakout).
13:53 Long Trade: SL Hit (Caught in the 23,840 rejection).
Trade Summary: Today was a day of mixed results for me. I managed to catch the V-shaped recovery move at 10:50 AM after the index defended the PDH, which turned out to be a successful trade. However, trying to push for more near the 23,840 resistance resulted in a stop-loss as the bulls failed to sustain the breakout. It was a good lesson in respecting the overhead “supply wall.”
🧱 Support & Resistance Levels
Resistance Zones: 23,840 | 24,020 ~ 24,040 (Major Hurdle)
Support Zones: 23,618 (Today’s Low) | 23,555 | 23,410 | 23,300 | 23,175 ~ 23,150
🧠 Final Thoughts
“Bulls are still leading, but the air is getting thin.”
The failure to sustain above 23,840 and the vanishing futures premium are warning signs I cannot ignore.
While the trend remains bullish, the base-building process may require a healthy pullback to the 23,300 ~ 23,400 levels to invite fresh buyers.
For tomorrow, I will be watching the 23,840 zone very closely—a decisive close above it opens the doors to 24,000, but a failure there confirms the need for a retracement.
Stay alert and trade cautiously.
✏️ Disclaimer
This is my personal digital diary and represents my own analysis and point of view. It is not financial advice; please consult a professional advisor before making any trading decisions.

Read my blogs here:
substack.com/@kzatakia
Follow me on Telegram:
t.me/swingtraderhub
Follow me on X:
x.com/kzatakia
substack.com/@kzatakia
Follow me on Telegram:
t.me/swingtraderhub
Follow me on X:
x.com/kzatakia
관련 발행물
면책사항
해당 정보와 게시물은 금융, 투자, 트레이딩 또는 기타 유형의 조언이나 권장 사항으로 간주되지 않으며, 트레이딩뷰에서 제공하거나 보증하는 것이 아닙니다. 자세한 내용은 이용 약관을 참조하세요.
Read my blogs here:
substack.com/@kzatakia
Follow me on Telegram:
t.me/swingtraderhub
Follow me on X:
x.com/kzatakia
substack.com/@kzatakia
Follow me on Telegram:
t.me/swingtraderhub
Follow me on X:
x.com/kzatakia
관련 발행물
면책사항
해당 정보와 게시물은 금융, 투자, 트레이딩 또는 기타 유형의 조언이나 권장 사항으로 간주되지 않으며, 트레이딩뷰에서 제공하거나 보증하는 것이 아닙니다. 자세한 내용은 이용 약관을 참조하세요.