
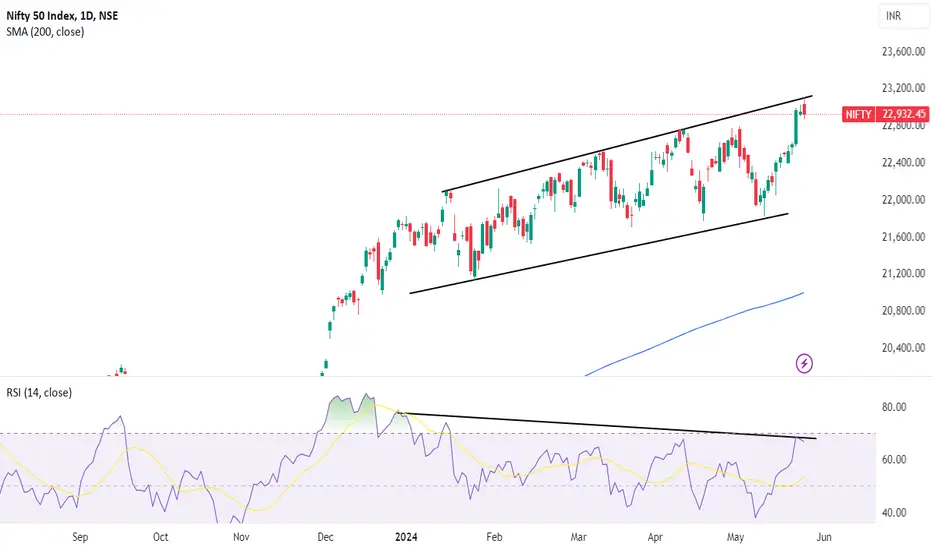
Also there is a formation Bearish RSI Divergence daily chart. On 15 January index reached a high of 22115 and the RSI value was at 74 today index reached a new high of 23043 but the RSI was at 67 this is a clear formation of RSI divergence.
노트
today it really down노트
🤕
면책사항
해당 정보와 게시물은 금융, 투자, 트레이딩 또는 기타 유형의 조언이나 권장 사항으로 간주되지 않으며, 트레이딩뷰에서 제공하거나 보증하는 것이 아닙니다. 자세한 내용은 이용 약관을 참조하세요.
면책사항
해당 정보와 게시물은 금융, 투자, 트레이딩 또는 기타 유형의 조언이나 권장 사항으로 간주되지 않으며, 트레이딩뷰에서 제공하거나 보증하는 것이 아닙니다. 자세한 내용은 이용 약관을 참조하세요.