This Analysis is not a trade recommendation, this study is purely for education purpose only, Do your own Study and Research before getting into any trades.
 NIFTY Weekly Analysis.
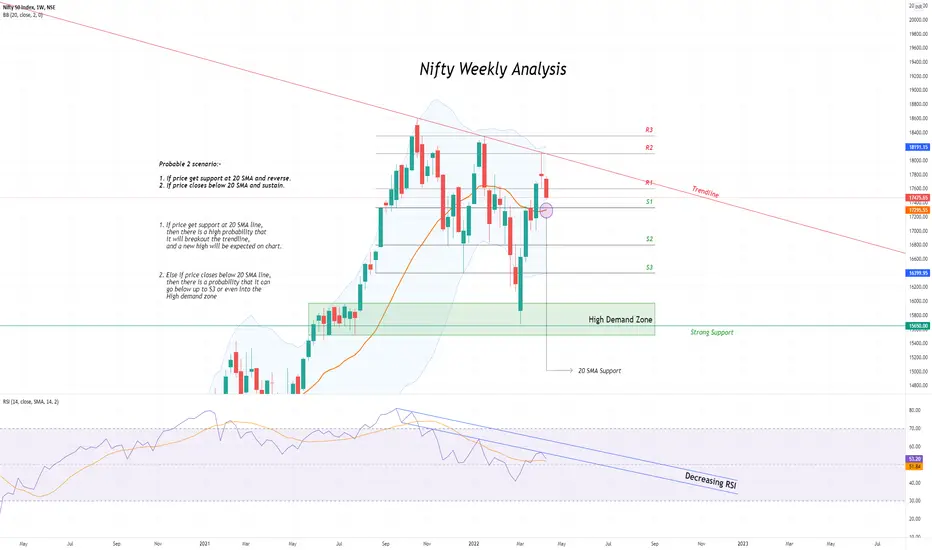
Currently Nifty is showing weakness on chart:-
1. Did not touch the upper Bollinger Band.
2. Continuously decreasing RSI.
If it fails to get support at the 20 SMA line, then there is a chance that nifty may touch the lower Bollinger Band at S3
NIFTY Weekly Analysis.Currently Nifty is showing weakness on chart:-
1. Did not touch the upper Bollinger Band.
2. Continuously decreasing RSI.
If it fails to get support at the 20 SMA line, then there is a chance that nifty may touch the lower Bollinger Band at S3

면책사항
해당 정보와 게시물은 금융, 투자, 트레이딩 또는 기타 유형의 조언이나 권장 사항으로 간주되지 않으며, 트레이딩뷰에서 제공하거나 보증하는 것이 아닙니다. 자세한 내용은 이용 약관을 참조하세요.
면책사항
해당 정보와 게시물은 금융, 투자, 트레이딩 또는 기타 유형의 조언이나 권장 사항으로 간주되지 않으며, 트레이딩뷰에서 제공하거나 보증하는 것이 아닙니다. 자세한 내용은 이용 약관을 참조하세요.