
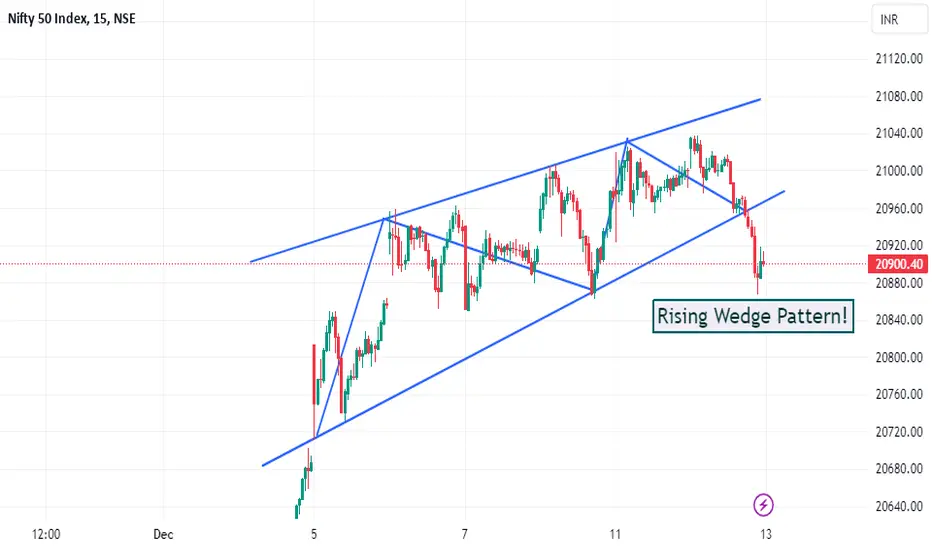
The Nifty 50 index exhibited a complex behavior, oscillating between 20,850 and 21,000, indicative of a period of consolidation. The chart reveals a rising wedge pattern, typically seen as a bearish signal in technical analysis. This pattern emerges amidst the index surpassing the 21,000 mark, reflecting strong economic indicators. For traders focusing on short-term movements, the 15-minute candle charts are essential for identifying immediate opportunities, especially in light of the expected increase in volatility due to the leap year and forthcoming elections in India.
Disclaimer - fyers.in/disclaimer/
Disclaimer - fyers.in/disclaimer/

면책사항
해당 정보와 게시물은 금융, 투자, 트레이딩 또는 기타 유형의 조언이나 권장 사항으로 간주되지 않으며, 트레이딩뷰에서 제공하거나 보증하는 것이 아닙니다. 자세한 내용은 이용 약관을 참조하세요.
면책사항
해당 정보와 게시물은 금융, 투자, 트레이딩 또는 기타 유형의 조언이나 권장 사항으로 간주되지 않으며, 트레이딩뷰에서 제공하거나 보증하는 것이 아닙니다. 자세한 내용은 이용 약관을 참조하세요.