
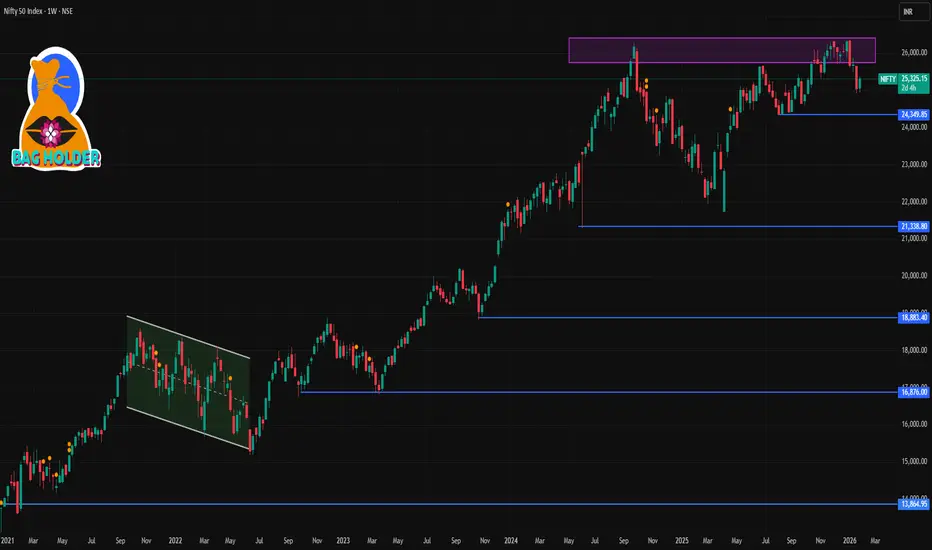
📊 Current Level (approx)
Nifty 50 ~ 25,200–25,350 area as of the last trading sessions (January 27–28, 2026).
📈 Key Weekly Levels to Watch
🔹 Immediate Resistance
1. ~25,300–25,350 — short‑term upside barrier (recent highs around these levels).
2. ~25,500–25,700+ — next major resistance zone (from prior weekly technical analysis, a breakout above ~26,100 historically signalled stronger bullish control).
🔻 Support Zones
1. ~24,900–25,000 — key short‑term support defended in recent sessions and noted by traders as a pivot area.
2. ~24,500–24,700 — broader weekly support zone (buffer from intermediate trend lines / moving averages).
3. ~24,200–24,300 — deeper weekly support; breach here could imply stronger correction risk.
📌 Weekly Trading Range (Probable)
Based on recent technical ranges and previous weekly outlooks:
➡️ Bullish bias above ~25,000 with resistance towards 25,500–25,700+.
➡️ Bearish/mixed bias if breaks below ~24,900, with support down to 24,500 and 24,200 zones.
⚠️ Important Notes
These levels are technical references used by traders — not investment advice.
Weekly support/resistance can shift quickly with strong market moves or macro events (especially around global policy news or earnings).
Always use stop losses and proper risk management if trading off these levels.
Nifty 50 ~ 25,200–25,350 area as of the last trading sessions (January 27–28, 2026).
📈 Key Weekly Levels to Watch
🔹 Immediate Resistance
1. ~25,300–25,350 — short‑term upside barrier (recent highs around these levels).
2. ~25,500–25,700+ — next major resistance zone (from prior weekly technical analysis, a breakout above ~26,100 historically signalled stronger bullish control).
🔻 Support Zones
1. ~24,900–25,000 — key short‑term support defended in recent sessions and noted by traders as a pivot area.
2. ~24,500–24,700 — broader weekly support zone (buffer from intermediate trend lines / moving averages).
3. ~24,200–24,300 — deeper weekly support; breach here could imply stronger correction risk.
📌 Weekly Trading Range (Probable)
Based on recent technical ranges and previous weekly outlooks:
➡️ Bullish bias above ~25,000 with resistance towards 25,500–25,700+.
➡️ Bearish/mixed bias if breaks below ~24,900, with support down to 24,500 and 24,200 zones.
⚠️ Important Notes
These levels are technical references used by traders — not investment advice.
Weekly support/resistance can shift quickly with strong market moves or macro events (especially around global policy news or earnings).
Always use stop losses and proper risk management if trading off these levels.

Contact Knowledgehub for a detailed consultation: Dm on WhatsApp: [wa.link/a2o0kz]-
Phone No: [+91 93102 26243]-
Email: [tradingviewknowledgehub@gmail.com]---
-- Let’s achieve success together!
Phone No: [+91 93102 26243]-
Email: [tradingviewknowledgehub@gmail.com]---
-- Let’s achieve success together!
관련 발행물
면책사항
해당 정보와 게시물은 금융, 투자, 트레이딩 또는 기타 유형의 조언이나 권장 사항으로 간주되지 않으며, 트레이딩뷰에서 제공하거나 보증하는 것이 아닙니다. 자세한 내용은 이용 약관을 참조하세요.
Contact Knowledgehub for a detailed consultation: Dm on WhatsApp: [wa.link/a2o0kz]-
Phone No: [+91 93102 26243]-
Email: [tradingviewknowledgehub@gmail.com]---
-- Let’s achieve success together!
Phone No: [+91 93102 26243]-
Email: [tradingviewknowledgehub@gmail.com]---
-- Let’s achieve success together!
관련 발행물
면책사항
해당 정보와 게시물은 금융, 투자, 트레이딩 또는 기타 유형의 조언이나 권장 사항으로 간주되지 않으며, 트레이딩뷰에서 제공하거나 보증하는 것이 아닙니다. 자세한 내용은 이용 약관을 참조하세요.