 NIFTY
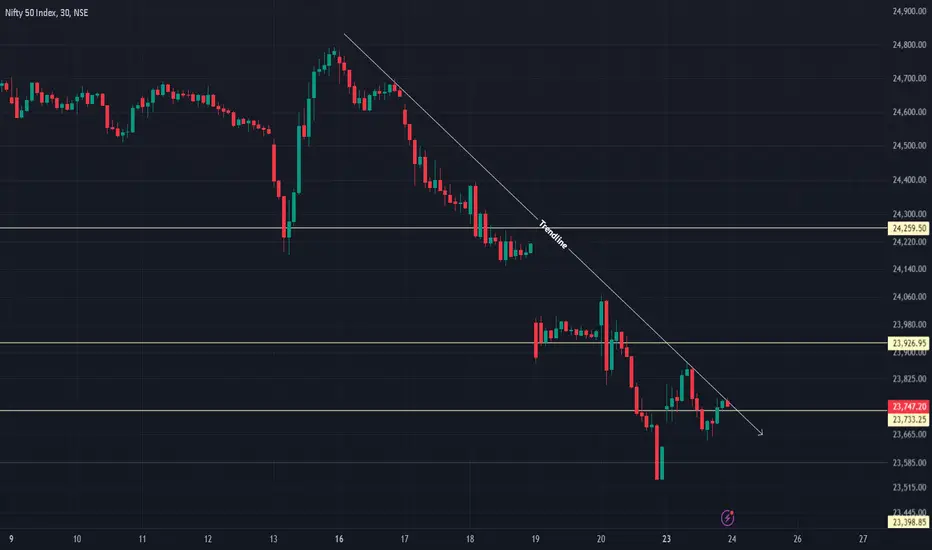
NIFTY NIFTY CHART ANALYSIS (24TH DEC)
Important Levels:
1. Resistance Levels:
- 24,259.50: Key resistance zone where selling pressure might build.
- 23,926.95: Immediate resistance near the current price.
2. Support Levels:
- 23,398.85: Major support level below the current price where buyers could step in.
3. Trendline:
- A downward trendline acts as dynamic resistance, connecting lower highs and reinforcing the bearish momentum.
Analysis:
- The price is in a bearish trend, consistently making lower highs and lower lows.
- Current Scenario: The price is near the trendline and could face rejection, continuing the downward move toward 23,398.85.
- Alternative Scenario: A breakout above the trendline might invalidate the bearish setup, potentially leading to a test of 23,926.95 or higher.
Only for educational purposes.
This content is not a recommendation to buy and sell.
Not SEBI REGISTRAR.

관련 발행물
면책사항
해당 정보와 게시물은 금융, 투자, 트레이딩 또는 기타 유형의 조언이나 권장 사항으로 간주되지 않으며, 트레이딩뷰에서 제공하거나 보증하는 것이 아닙니다. 자세한 내용은 이용 약관을 참조하세요.
면책사항
해당 정보와 게시물은 금융, 투자, 트레이딩 또는 기타 유형의 조언이나 권장 사항으로 간주되지 않으며, 트레이딩뷰에서 제공하거나 보증하는 것이 아닙니다. 자세한 내용은 이용 약관을 참조하세요.