
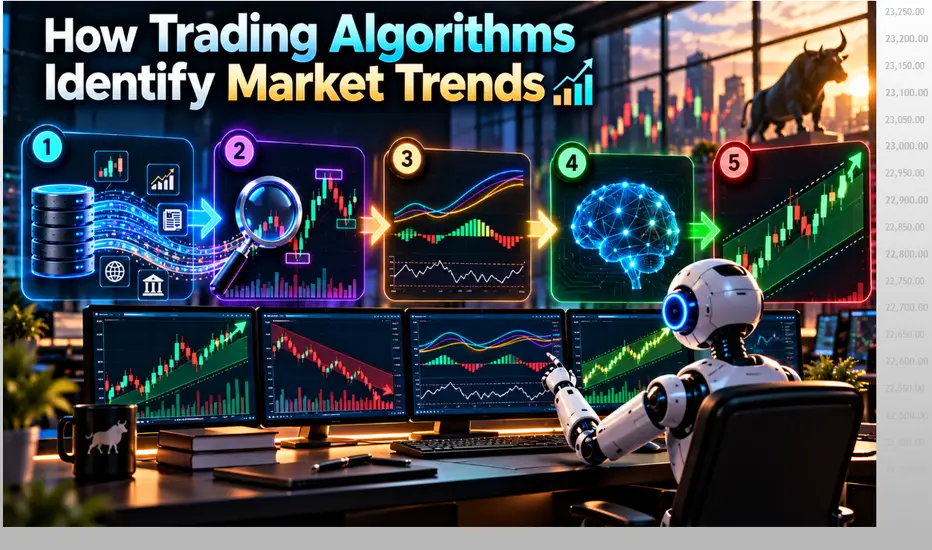
🤖 How Trading Algorithms Identify Market Trends
A trader can look at a chart and say: “This market looks bullish.”
But an algorithm needs something more precise. It must convert the trend into measurable conditions.
For example:
Higher Highs + Higher Lows
+ Price Above VWAP
+ 20 EMA Above 50 EMA
+ Trend Strength
= **Bullish Trend**
---------------------------------
📊 Price Structure Comes First
A simple bullish structure looks like:
**HH → HL → HH → HL**
A bearish structure looks like:
**LL → LH → LL → LH**
Algorithms can identify confirmed swing highs and lows and compare them automatically. This turns price action into machine-readable trend logic.
---------------------------------
📈 Moving Averages Help Filter Direction
Example:
Price > 20 EMA
20 EMA > 50 EMA
Both averages rising
= Bullish alignment
For bearish conditions:
Price < 20 EMA
20 EMA < 50 EMA
Both averages falling
= Bearish alignment
A crossover alone may not be enough, especially in a sideways market.
---------------------------------
📊 VWAP Can Help With Intraday Trend
A bullish intraday environment may show:
✅ Price above VWAP
✅ VWAP rising
✅ Pullbacks holding VWAP
A bearish environment may show the opposite.
If VWAP is flat and price keeps crossing it: The algorithm may classify the market as **sideways**.
---------------------------------
⚡ Direction Is Not the Same as Strength
A market can be bullish but weak.
That is why algorithms may also use:
• ADX
• EMA slope
• ATR expansion
• Rate of change
• Volume
These help answer:
“Is this actually trending strongly enough to trade?”
---------------------------------
🔍 Higher-Timeframe Context Matters
Example:
Now multiple timeframes agree. But if the higher timeframe is bearish, the same lower-timeframe long setup may be filtered out.
---------------------------------
📊 Algorithms Can Use a Trend Score
Example:
Price above 50 EMA = 20
EMA alignment = 20
Bullish structure = 20
VWAP alignment = 15
ADX = 15
Volume = 10
Total = 100
The system can then classify:
Strong Bullish
Mild Bullish
Neutral
Mild Bearish
Strong Bearish
The exact scoring model should always be tested.
---------------------------------
⚠️ Sideways Is Also a Valid Answer
One of the biggest mistakes is forcing every market into:
Bullish or Bearish.
Sometimes the correct algorithmic classification is:
**NO TREND**
Possible clues:
• Flat moving averages
• Low ADX
• Narrow ATR
• Repeated VWAP crosses
• No clean HH/HL or LH/LL sequence
In that environment, a trend-following strategy may simply stay inactive.
---------------------------------
📊 Simple Formula
Price Structure + Direction Filter + Trend Strength + Confirmation
= Trend Classification
Trend Classification + Setup Trigger
= Higher-Quality Trade Opportunity
But:
No Clear Trend
= WAIT
---------------------------------
📊 Finally, the important point to note is:
Algorithms do not need to predict exactly where the market will go. They only need to classify the current environment consistently.
The goal is to identify:
**Bullish → Bearish → Sideways**
using objective evidence.
A good trend engine helps the strategy trade with the market environment instead of fighting it.
---------------------------------
Educational Purpose Only. Whats Your View On this Idea ? Comment Below !!
A trader can look at a chart and say: “This market looks bullish.”
But an algorithm needs something more precise. It must convert the trend into measurable conditions.
For example:
Higher Highs + Higher Lows
+ Price Above VWAP
+ 20 EMA Above 50 EMA
+ Trend Strength
= **Bullish Trend**
---------------------------------
📊 Price Structure Comes First
A simple bullish structure looks like:
**HH → HL → HH → HL**
A bearish structure looks like:
**LL → LH → LL → LH**
Algorithms can identify confirmed swing highs and lows and compare them automatically. This turns price action into machine-readable trend logic.
---------------------------------
📈 Moving Averages Help Filter Direction
Example:
Price > 20 EMA
20 EMA > 50 EMA
Both averages rising
= Bullish alignment
For bearish conditions:
Price < 20 EMA
20 EMA < 50 EMA
Both averages falling
= Bearish alignment
A crossover alone may not be enough, especially in a sideways market.
---------------------------------
📊 VWAP Can Help With Intraday Trend
A bullish intraday environment may show:
✅ Price above VWAP
✅ VWAP rising
✅ Pullbacks holding VWAP
A bearish environment may show the opposite.
If VWAP is flat and price keeps crossing it: The algorithm may classify the market as **sideways**.
---------------------------------
⚡ Direction Is Not the Same as Strength
A market can be bullish but weak.
That is why algorithms may also use:
• ADX
• EMA slope
• ATR expansion
• Rate of change
• Volume
These help answer:
“Is this actually trending strongly enough to trade?”
---------------------------------
🔍 Higher-Timeframe Context Matters
Example:
- 1-Hour Trend = Bullish
- 15-Minute Setup = Bullish Pullback
- 5-Minute Trigger = Confirmed
Now multiple timeframes agree. But if the higher timeframe is bearish, the same lower-timeframe long setup may be filtered out.
---------------------------------
📊 Algorithms Can Use a Trend Score
Example:
Price above 50 EMA = 20
EMA alignment = 20
Bullish structure = 20
VWAP alignment = 15
ADX = 15
Volume = 10
Total = 100
The system can then classify:
Strong Bullish
Mild Bullish
Neutral
Mild Bearish
Strong Bearish
The exact scoring model should always be tested.
---------------------------------
⚠️ Sideways Is Also a Valid Answer
One of the biggest mistakes is forcing every market into:
Bullish or Bearish.
Sometimes the correct algorithmic classification is:
**NO TREND**
Possible clues:
• Flat moving averages
• Low ADX
• Narrow ATR
• Repeated VWAP crosses
• No clean HH/HL or LH/LL sequence
In that environment, a trend-following strategy may simply stay inactive.
---------------------------------
📊 Simple Formula
Price Structure + Direction Filter + Trend Strength + Confirmation
= Trend Classification
Trend Classification + Setup Trigger
= Higher-Quality Trade Opportunity
But:
No Clear Trend
= WAIT
---------------------------------
📊 Finally, the important point to note is:
Algorithms do not need to predict exactly where the market will go. They only need to classify the current environment consistently.
The goal is to identify:
**Bullish → Bearish → Sideways**
using objective evidence.
A good trend engine helps the strategy trade with the market environment instead of fighting it.
---------------------------------
Educational Purpose Only. Whats Your View On this Idea ? Comment Below !!

⭐For Live Trading Courses And Trading Community 📈
Contact ⬇️
📱wa.me/919322295961
📱t.me/+UgF9lES_XxA0MTk9
⭐Advanced courses
⭐Fully Automated Algo Trading
⭐Daily F&O Trade tips
📱 t.me/+UgF9lES_XxA0MTk9
Contact ⬇️
📱wa.me/919322295961
📱t.me/+UgF9lES_XxA0MTk9
⭐Advanced courses
⭐Fully Automated Algo Trading
⭐Daily F&O Trade tips
📱 t.me/+UgF9lES_XxA0MTk9
관련 발행물
면책사항
해당 정보와 게시물은 금융, 투자, 트레이딩 또는 기타 유형의 조언이나 권장 사항으로 간주되지 않으며, 트레이딩뷰에서 제공하거나 보증하는 것이 아닙니다. 자세한 내용은 이용 약관을 참조하세요.
⭐For Live Trading Courses And Trading Community 📈
Contact ⬇️
📱wa.me/919322295961
📱t.me/+UgF9lES_XxA0MTk9
⭐Advanced courses
⭐Fully Automated Algo Trading
⭐Daily F&O Trade tips
📱 t.me/+UgF9lES_XxA0MTk9
Contact ⬇️
📱wa.me/919322295961
📱t.me/+UgF9lES_XxA0MTk9
⭐Advanced courses
⭐Fully Automated Algo Trading
⭐Daily F&O Trade tips
📱 t.me/+UgF9lES_XxA0MTk9
관련 발행물
면책사항
해당 정보와 게시물은 금융, 투자, 트레이딩 또는 기타 유형의 조언이나 권장 사항으로 간주되지 않으며, 트레이딩뷰에서 제공하거나 보증하는 것이 아닙니다. 자세한 내용은 이용 약관을 참조하세요.