
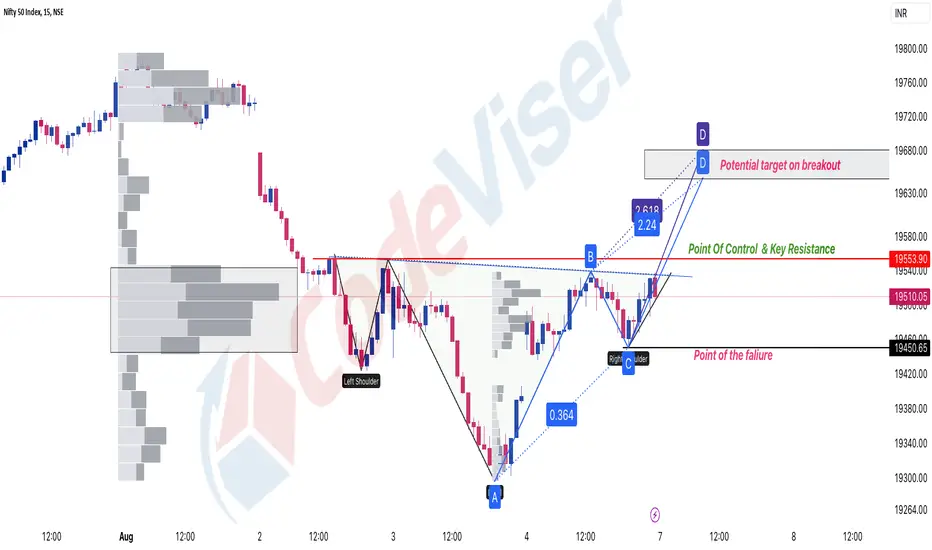
I've used charts to show things clearly. On Monday, there are two critical levels to watch. The first is 19,560 – a critical resistance point because the Index has been stopped by it many times before. If the Index breaks past this point, it might show a new trend (a change in how prices move). The second level is the low point, which might mean the prices will continue decreasing. If prices are between these two levels, it's not a good time to trade. I've also pointed out possible goals if the resistance level is crossed.
So, when you trade, remember these things.
So, when you trade, remember these things.

Telegram: t.me/Virendrapandey81
Website: vpcapitalresearch.com
Follow us on Twitter: twitter.com/Virupandey81
YouTube: youtube.com/@codeviser
Website: vpcapitalresearch.com
Follow us on Twitter: twitter.com/Virupandey81
YouTube: youtube.com/@codeviser
면책사항
해당 정보와 게시물은 금융, 투자, 트레이딩 또는 기타 유형의 조언이나 권장 사항으로 간주되지 않으며, 트레이딩뷰에서 제공하거나 보증하는 것이 아닙니다. 자세한 내용은 이용 약관을 참조하세요.
Telegram: t.me/Virendrapandey81
Website: vpcapitalresearch.com
Follow us on Twitter: twitter.com/Virupandey81
YouTube: youtube.com/@codeviser
Website: vpcapitalresearch.com
Follow us on Twitter: twitter.com/Virupandey81
YouTube: youtube.com/@codeviser
면책사항
해당 정보와 게시물은 금융, 투자, 트레이딩 또는 기타 유형의 조언이나 권장 사항으로 간주되지 않으며, 트레이딩뷰에서 제공하거나 보증하는 것이 아닙니다. 자세한 내용은 이용 약관을 참조하세요.