
Key observation: NIFTY has shown strong upward momentum after the BUY signal. Will the index continue towards Target 2, or pause for consolidation? Observe price action around the upcoming reference levels and evaluate the chart against your own trading plan and risk limits.
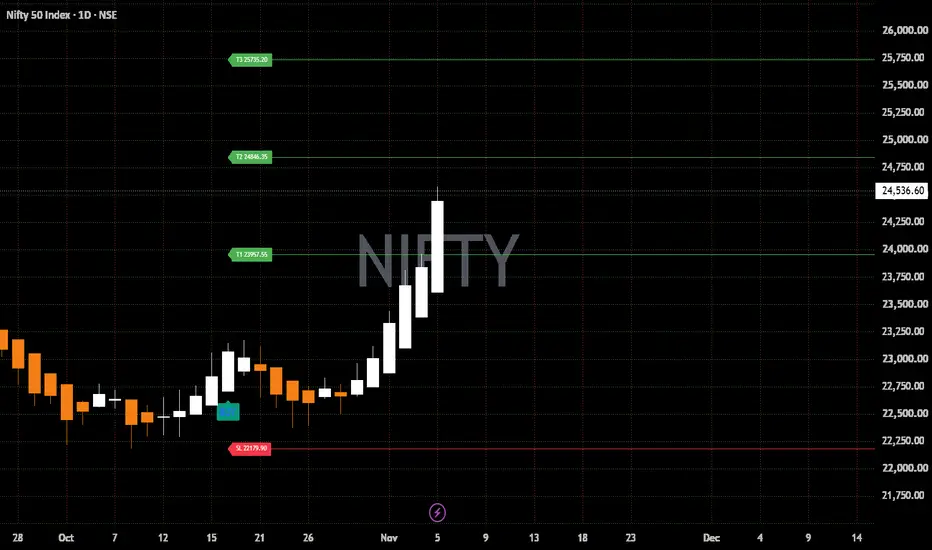
The chart shows a BUY signal, followed by a strong upward price move. Price has moved beyond Target 1 and is now approaching the Target 2 reference zone.
Chart reference levels:
Entry reference: As indicated by the BUY label
Stop-loss level: 22,179.90
Target 1: 23,957.55
Target 2: 24,846.35
Target 3: 25,735.20
These are indicator-generated reference levels for technical analysis, not predictions or guaranteed outcomes. Price may move in either direction, and the setup can fail.
Key observation: NIFTY has shown strong upward momentum after the BUY signal. Will the index continue towards Target 2, or pause for consolidation? Observe price action around the upcoming reference levels and evaluate the chart against your own trading plan and risk limits.
Disclaimer: This post is for educational and informational purposes only. It is not a recommendation to buy, sell, or hold any security or derivative. No returns are assured. Trading involves risk; please do your own research and consult a SEBI-registered investment adviser where appropriate.
The chart shows a BUY signal, followed by a strong upward price move. Price has moved beyond Target 1 and is now approaching the Target 2 reference zone.
Chart reference levels:
Entry reference: As indicated by the BUY label
Stop-loss level: 22,179.90
Target 1: 23,957.55
Target 2: 24,846.35
Target 3: 25,735.20
These are indicator-generated reference levels for technical analysis, not predictions or guaranteed outcomes. Price may move in either direction, and the setup can fail.
Key observation: NIFTY has shown strong upward momentum after the BUY signal. Will the index continue towards Target 2, or pause for consolidation? Observe price action around the upcoming reference levels and evaluate the chart against your own trading plan and risk limits.
Disclaimer: This post is for educational and informational purposes only. It is not a recommendation to buy, sell, or hold any security or derivative. No returns are assured. Trading involves risk; please do your own research and consult a SEBI-registered investment adviser where appropriate.

관련 발행물
면책사항
해당 정보와 게시물은 금융, 투자, 트레이딩 또는 기타 유형의 조언이나 권장 사항으로 간주되지 않으며, 트레이딩뷰에서 제공하거나 보증하는 것이 아닙니다. 자세한 내용은 이용 약관을 참조하세요.
면책사항
해당 정보와 게시물은 금융, 투자, 트레이딩 또는 기타 유형의 조언이나 권장 사항으로 간주되지 않으며, 트레이딩뷰에서 제공하거나 보증하는 것이 아닙니다. 자세한 내용은 이용 약관을 참조하세요.