
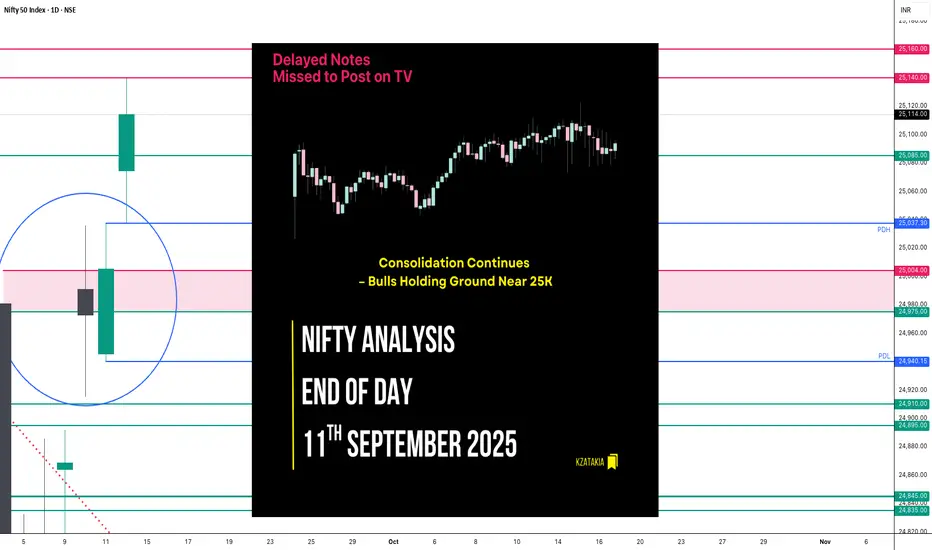
Delayed Note : Missed to Post on TV
🟢 Nifty Analysis EOD – September 11, 2025 – Thursday 🔴
Consolidation Continues – Bulls Holding Ground Near 25K
🗞 Nifty Summary
Nifty started flat and within minutes marked a low of 24,940 and high of 25,008. Most of the day was spent within this narrow IB Zone, with multiple fakeouts of IB High that made life tough for intraday traders.
After 2:30 PM, candles spiked 2–3x average range, signaling bulls trying to breach the previous day’s high and hold above 25K, while bears dragged it back from the upper zone. Such tug-of-war periods made it tricky, and traders likely faced tough moments.
However, by the end of the day, Nifty managed to close above 25,000 at 25,008.10.
This session was largely a consolidation day, similar to yesterday, with the entire movement contained within the previous day’s range, forming an Inside Bar structure.
Yesterday’s range: 120.65 points
Today’s range: 97.15 points
Gladiator Indicator shows average range: 183.74 → indicates upcoming potential expansion.
Hold tight, seat tight.
🛡 5 Min Intraday Chart with Levels

📉 Daily Time Frame Chart with Intraday Levels

🕯 Daily Candle Breakdown
Open: 24,945.50
High: 25,037.30
Low: 24,940.15
Close: 25,005.50
Change: +32.40 (+0.13%)
🏗️ Structure Breakdown
Green candle (Close > Open).
Body: 60.00 points → moderate.
Upper wick: 31.80 points.
Lower wick: 5.35 points → almost no tail.
Market closed near day’s high, showing bullish bias.
📚 Interpretation
Market remained in a narrow range (approx. 97 points).
Buyers controlled the session — open near low, close near high.
Very small lower wick → minimal selling pressure.
Upper wick reflects resistance near 25,037.
🕯Candle Type
Small Bullish Candle / Near Marubozu type → suggests steady but controlled buying.
📉📈 Short-Term View – September 11, 2025
Support: 24,940–24,945 (today’s defended zone).
Resistance: 25,030–25,040 (where price paused again).
👉 Key Insight:
Bulls are gradually pressing higher, yet stuck below 25,030–25,050 resistance band.
Context over the last two days:
Market is consolidating tightly between 24,900–25,035.
Every session reflects indecision but with a bullish undertone → buyers holding ground, sellers blocking at the top.
A clear breakout is brewing.
🛡 5 Min Intraday Chart

⚔️ Gladiator Strategy Update
ATR: 183.74
IB Range: 68.8 → Medium
Market Structure: Balanced
Trade Highlights:
12:10 AM – Long Trigger → Target Hit (R:R 1:1.5)
13:45 PM – Long Trigger → SL Hit
📌 Support & Resistance Levels
Resistance Zones:
24,975 ~ 25,004
25,035 ~ 25,140
25,160
Support Zones:
24,915 ~ 24,895
24,845 ~ 24,835
24,785
💡 Final Thoughts
Today’s session adds to the consolidation narrative, with bulls defending near 25,000 and gradual attempt to break higher resistance. A breakout above 25,040 could finally trigger fresh momentum. Until then, expect choppy action with tight ranges.
📖 “Strength grows in moments of resistance – patience pays in the end.”
✏️ Disclaimer
This is just my personal viewpoint. Always consult your financial advisor before taking any action.
🟢 Nifty Analysis EOD – September 11, 2025 – Thursday 🔴
Consolidation Continues – Bulls Holding Ground Near 25K
🗞 Nifty Summary
Nifty started flat and within minutes marked a low of 24,940 and high of 25,008. Most of the day was spent within this narrow IB Zone, with multiple fakeouts of IB High that made life tough for intraday traders.
After 2:30 PM, candles spiked 2–3x average range, signaling bulls trying to breach the previous day’s high and hold above 25K, while bears dragged it back from the upper zone. Such tug-of-war periods made it tricky, and traders likely faced tough moments.
However, by the end of the day, Nifty managed to close above 25,000 at 25,008.10.
This session was largely a consolidation day, similar to yesterday, with the entire movement contained within the previous day’s range, forming an Inside Bar structure.
Yesterday’s range: 120.65 points
Today’s range: 97.15 points
Gladiator Indicator shows average range: 183.74 → indicates upcoming potential expansion.
Hold tight, seat tight.
🛡 5 Min Intraday Chart with Levels
📉 Daily Time Frame Chart with Intraday Levels
🕯 Daily Candle Breakdown
Open: 24,945.50
High: 25,037.30
Low: 24,940.15
Close: 25,005.50
Change: +32.40 (+0.13%)
🏗️ Structure Breakdown
Green candle (Close > Open).
Body: 60.00 points → moderate.
Upper wick: 31.80 points.
Lower wick: 5.35 points → almost no tail.
Market closed near day’s high, showing bullish bias.
📚 Interpretation
Market remained in a narrow range (approx. 97 points).
Buyers controlled the session — open near low, close near high.
Very small lower wick → minimal selling pressure.
Upper wick reflects resistance near 25,037.
🕯Candle Type
Small Bullish Candle / Near Marubozu type → suggests steady but controlled buying.
📉📈 Short-Term View – September 11, 2025
Support: 24,940–24,945 (today’s defended zone).
Resistance: 25,030–25,040 (where price paused again).
👉 Key Insight:
Bulls are gradually pressing higher, yet stuck below 25,030–25,050 resistance band.
Context over the last two days:
Market is consolidating tightly between 24,900–25,035.
Every session reflects indecision but with a bullish undertone → buyers holding ground, sellers blocking at the top.
A clear breakout is brewing.
🛡 5 Min Intraday Chart
⚔️ Gladiator Strategy Update
ATR: 183.74
IB Range: 68.8 → Medium
Market Structure: Balanced
Trade Highlights:
12:10 AM – Long Trigger → Target Hit (R:R 1:1.5)
13:45 PM – Long Trigger → SL Hit
📌 Support & Resistance Levels
Resistance Zones:
24,975 ~ 25,004
25,035 ~ 25,140
25,160
Support Zones:
24,915 ~ 24,895
24,845 ~ 24,835
24,785
💡 Final Thoughts
Today’s session adds to the consolidation narrative, with bulls defending near 25,000 and gradual attempt to break higher resistance. A breakout above 25,040 could finally trigger fresh momentum. Until then, expect choppy action with tight ranges.
📖 “Strength grows in moments of resistance – patience pays in the end.”
✏️ Disclaimer
This is just my personal viewpoint. Always consult your financial advisor before taking any action.

Read my blogs here:
substack.com/@kzatakia
Follow me on Telegram:
t.me/swingtraderhub
Follow me on X:
x.com/kzatakia
substack.com/@kzatakia
Follow me on Telegram:
t.me/swingtraderhub
Follow me on X:
x.com/kzatakia
관련 발행물
면책사항
해당 정보와 게시물은 금융, 투자, 트레이딩 또는 기타 유형의 조언이나 권장 사항으로 간주되지 않으며, 트레이딩뷰에서 제공하거나 보증하는 것이 아닙니다. 자세한 내용은 이용 약관을 참조하세요.
Read my blogs here:
substack.com/@kzatakia
Follow me on Telegram:
t.me/swingtraderhub
Follow me on X:
x.com/kzatakia
substack.com/@kzatakia
Follow me on Telegram:
t.me/swingtraderhub
Follow me on X:
x.com/kzatakia
관련 발행물
면책사항
해당 정보와 게시물은 금융, 투자, 트레이딩 또는 기타 유형의 조언이나 권장 사항으로 간주되지 않으며, 트레이딩뷰에서 제공하거나 보증하는 것이 아닙니다. 자세한 내용은 이용 약관을 참조하세요.