
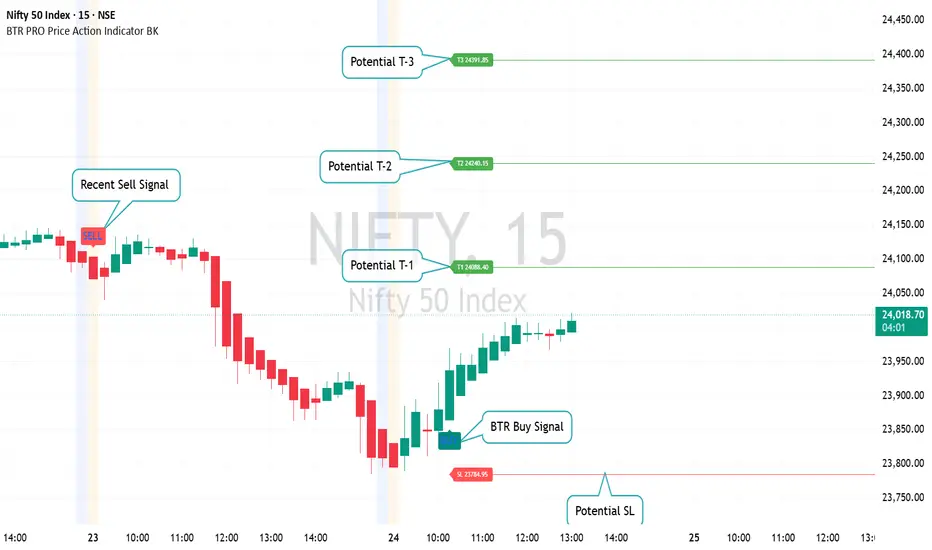
NIFTY has shown a strong recovery after yesterday's weakness, with a fresh BTR Buy Signal appearing near the intraday support zone. Price is currently trading around the psychological 24,000 level and attempting to build short-term bullish momentum.
BTR Trade Framework
🟢 Buy Signal Activated
❌ Potential SL: 23,784.95
🎯 Potential T-1: 24,088.40
🎯 Potential T-2: 24,240.15
🎯 Potential T-3: 24,391.85
Price Action Observations
• Yesterday's sell signal captured the intraday decline effectively.
• Today's buy signal emerged after a successful support hold and trend reversal.
• Price has recovered sharply and is consolidating near the 24,000 zone.
• A sustained move above the current consolidation area may improve the probability of testing higher resistance levels.
• The first target zone near 24,088 remains an important level for short-term traders.
Market Structure
📈 Short-term structure has shifted from bearish to bullish.
📈 Higher lows are forming after the recent reversal.
📈 Buyers remain in control while price holds above the defined risk level.
📈 Momentum confirmation may come from a breakout above the current consolidation range.
Educational Note
A common price action sequence is:
➡️ Decline
➡️ Base Formation
➡️ Trend Reversal Signal
➡️ Momentum Expansion
The current NIFTY structure is attempting to follow this sequence. Traders often monitor whether the market can maintain higher lows after a reversal signal rather than focusing solely on targets.
⚠️ This analysis is for educational purposes only and should not be considered investment advice. Markets are uncertain, and all trading decisions involve risk.
#NIFTY #Nifty50 #IntradayTrading #PriceAction #TechnicalAnalysis #MarketStructure #TrendFollowing #TradingEducation #IndianStockMarket #TradingViewIndia #BKQuantDesk
BTR Trade Framework
🟢 Buy Signal Activated
❌ Potential SL: 23,784.95
🎯 Potential T-1: 24,088.40
🎯 Potential T-2: 24,240.15
🎯 Potential T-3: 24,391.85
Price Action Observations
• Yesterday's sell signal captured the intraday decline effectively.
• Today's buy signal emerged after a successful support hold and trend reversal.
• Price has recovered sharply and is consolidating near the 24,000 zone.
• A sustained move above the current consolidation area may improve the probability of testing higher resistance levels.
• The first target zone near 24,088 remains an important level for short-term traders.
Market Structure
📈 Short-term structure has shifted from bearish to bullish.
📈 Higher lows are forming after the recent reversal.
📈 Buyers remain in control while price holds above the defined risk level.
📈 Momentum confirmation may come from a breakout above the current consolidation range.
Educational Note
A common price action sequence is:
➡️ Decline
➡️ Base Formation
➡️ Trend Reversal Signal
➡️ Momentum Expansion
The current NIFTY structure is attempting to follow this sequence. Traders often monitor whether the market can maintain higher lows after a reversal signal rather than focusing solely on targets.
⚠️ This analysis is for educational purposes only and should not be considered investment advice. Markets are uncertain, and all trading decisions involve risk.
#NIFTY #Nifty50 #IntradayTrading #PriceAction #TechnicalAnalysis #MarketStructure #TrendFollowing #TradingEducation #IndianStockMarket #TradingViewIndia #BKQuantDesk
액티브 트레이드
T-1 Reached
관련 발행물
면책사항
해당 정보와 게시물은 금융, 투자, 트레이딩 또는 기타 유형의 조언이나 권장 사항으로 간주되지 않으며, 트레이딩뷰에서 제공하거나 보증하는 것이 아닙니다. 자세한 내용은 이용 약관을 참조하세요.
면책사항
해당 정보와 게시물은 금융, 투자, 트레이딩 또는 기타 유형의 조언이나 권장 사항으로 간주되지 않으며, 트레이딩뷰에서 제공하거나 보증하는 것이 아닙니다. 자세한 내용은 이용 약관을 참조하세요.