
So NIO has been tanking lately.
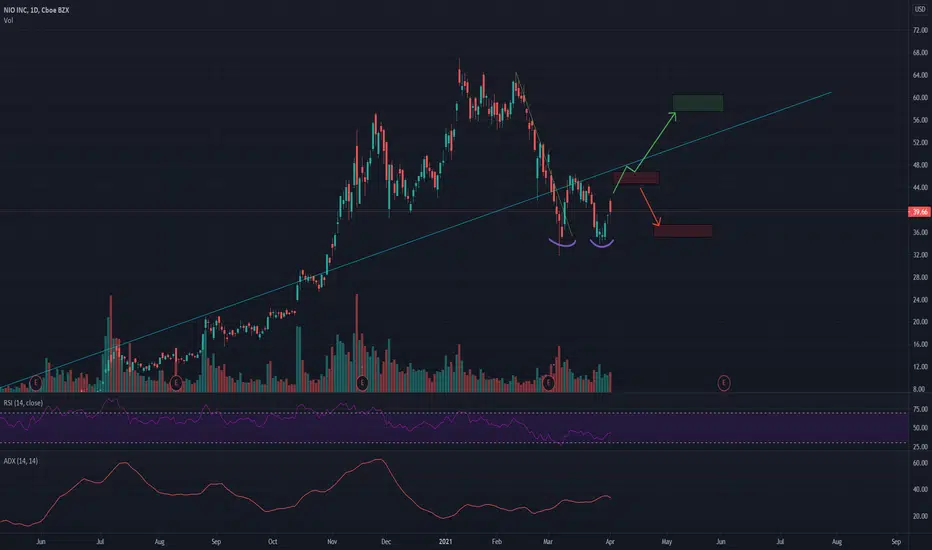
But right now what we can see is a double bottom pattern which might lead us back to a higher price.
The first resistance area is around 44-46 above it is a long trend line which right now works as a resistance.
We could pass the red area and test it as a support then I expect a move up.
If the test goes wrong we could easily drop back to the area around 35.
As we all know... the price of all EVs depends on TSLA and with the news that just came up I expect Tesla to be bullish this week.
We will see.
Remember this just a chart idea not fundamentals and it is not including that it is a Chinese stock.
But right now what we can see is a double bottom pattern which might lead us back to a higher price.
The first resistance area is around 44-46 above it is a long trend line which right now works as a resistance.
We could pass the red area and test it as a support then I expect a move up.
If the test goes wrong we could easily drop back to the area around 35.
As we all know... the price of all EVs depends on TSLA and with the news that just came up I expect Tesla to be bullish this week.
We will see.
Remember this just a chart idea not fundamentals and it is not including that it is a Chinese stock.

면책사항
해당 정보와 게시물은 금융, 투자, 트레이딩 또는 기타 유형의 조언이나 권장 사항으로 간주되지 않으며, 트레이딩뷰에서 제공하거나 보증하는 것이 아닙니다. 자세한 내용은 이용 약관을 참조하세요.
면책사항
해당 정보와 게시물은 금융, 투자, 트레이딩 또는 기타 유형의 조언이나 권장 사항으로 간주되지 않으며, 트레이딩뷰에서 제공하거나 보증하는 것이 아닙니다. 자세한 내용은 이용 약관을 참조하세요.