
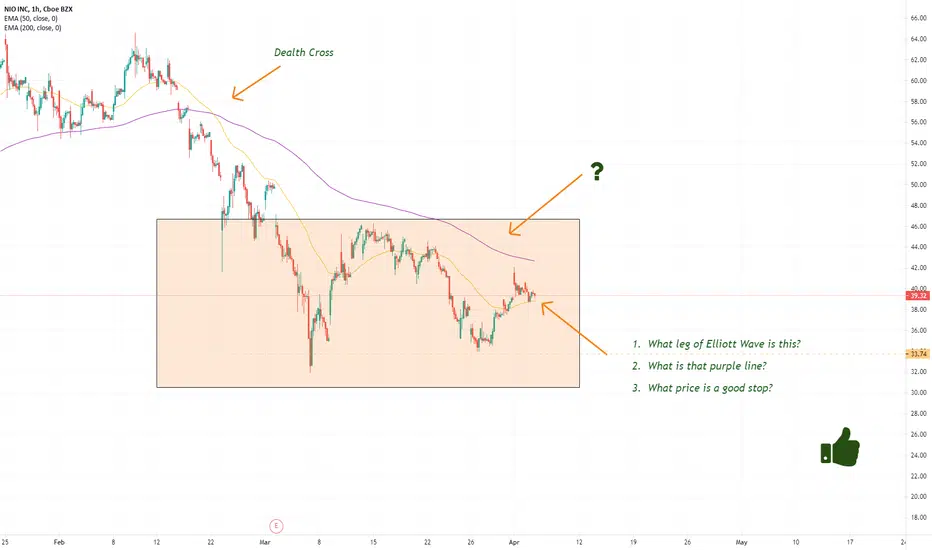
1. What leg of Elliott Wave is this? Double Bottom in Leg B
2. What is that purple line? Major Resistance
3. What price is a good stop? $33.74
Thank you for reading!
Greenfield
Starting April 19, for early access to my weekly chart price interpretation for cryptocurrency, gold, and a random stock, please subscribe to my YouTube.
youtube.com/channel/UC1uQWStOxAlA27PAuOdfZxw/videos
Disclosure: I am not a financial advisor. This is not a recommendation, not a representation, and not a solicitation. You should do your research and come to your own decision. Investment involves significant risks. You need to understand that you may lose your money. Past performance is not an indication of future performance. Chart reading is subjective information.

관련 발행물
면책사항
해당 정보와 게시물은 금융, 투자, 트레이딩 또는 기타 유형의 조언이나 권장 사항으로 간주되지 않으며, 트레이딩뷰에서 제공하거나 보증하는 것이 아닙니다. 자세한 내용은 이용 약관을 참조하세요.
면책사항
해당 정보와 게시물은 금융, 투자, 트레이딩 또는 기타 유형의 조언이나 권장 사항으로 간주되지 않으며, 트레이딩뷰에서 제공하거나 보증하는 것이 아닙니다. 자세한 내용은 이용 약관을 참조하세요.