
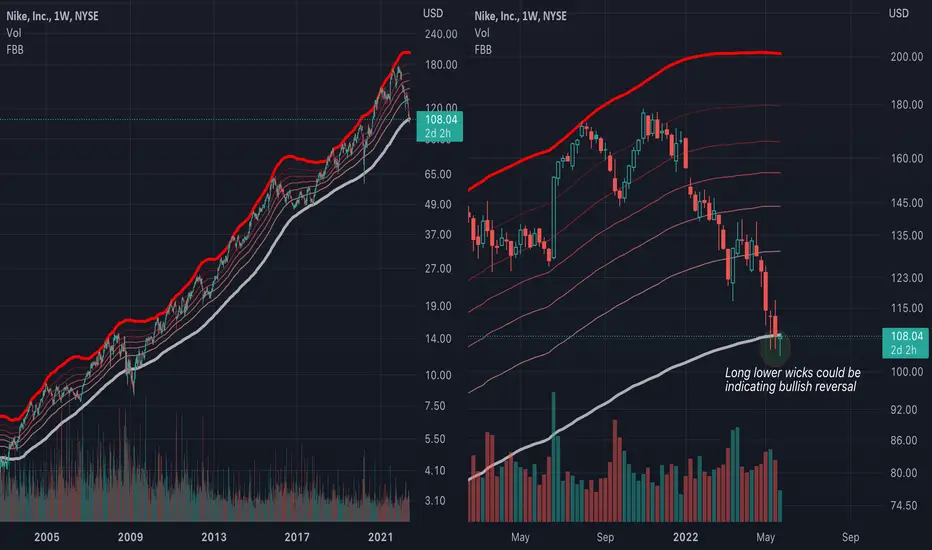
Just an observation: Nike (NKE) is currently sitting on the Fibonacci Bollinger Band (FBB) plot line that has generally acted as support for the past 20 years. The weekly candles are printing long lower wicks which could suggest a bullish reversal is building along this line. The yearly chart is not overextended and fitting perfectly on multiple linear log trend lines that stretch back decades. Seems like a warning to those who are selling or shorting Nike at this level. Anyone feel differently?
Not financial advice.
Not financial advice.

면책사항
해당 정보와 게시물은 금융, 투자, 트레이딩 또는 기타 유형의 조언이나 권장 사항으로 간주되지 않으며, 트레이딩뷰에서 제공하거나 보증하는 것이 아닙니다. 자세한 내용은 이용 약관을 참조하세요.
면책사항
해당 정보와 게시물은 금융, 투자, 트레이딩 또는 기타 유형의 조언이나 권장 사항으로 간주되지 않으며, 트레이딩뷰에서 제공하거나 보증하는 것이 아닙니다. 자세한 내용은 이용 약관을 참조하세요.