
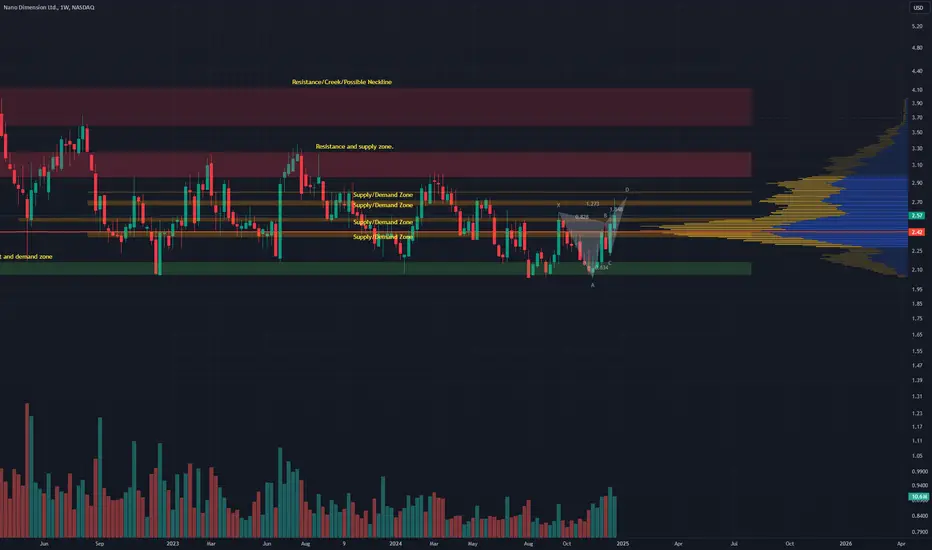
Disclaimer: The fox is in the hen house. Murch has taken over and my investment strategy has now changed. I am no longer an investor and will be selling my position as the price skyrockets. Murch has done this before with Dryship. NNDM will be parceled out and sold off for cash.
Having said that, my final chart. These supply/demand zones have not changed in years. Orange is daily and below. Red is Daily and above. You need to break these zones and establish them as support before moving to the next. Look for volume to increase as this happens.
Butterfly just completed at an coincidental spot. Look for retracements to 236, 382, 500 or 618 of the CD leg.

면책사항
해당 정보와 게시물은 금융, 투자, 트레이딩 또는 기타 유형의 조언이나 권장 사항으로 간주되지 않으며, 트레이딩뷰에서 제공하거나 보증하는 것이 아닙니다. 자세한 내용은 이용 약관을 참조하세요.
면책사항
해당 정보와 게시물은 금융, 투자, 트레이딩 또는 기타 유형의 조언이나 권장 사항으로 간주되지 않으며, 트레이딩뷰에서 제공하거나 보증하는 것이 아닙니다. 자세한 내용은 이용 약관을 참조하세요.