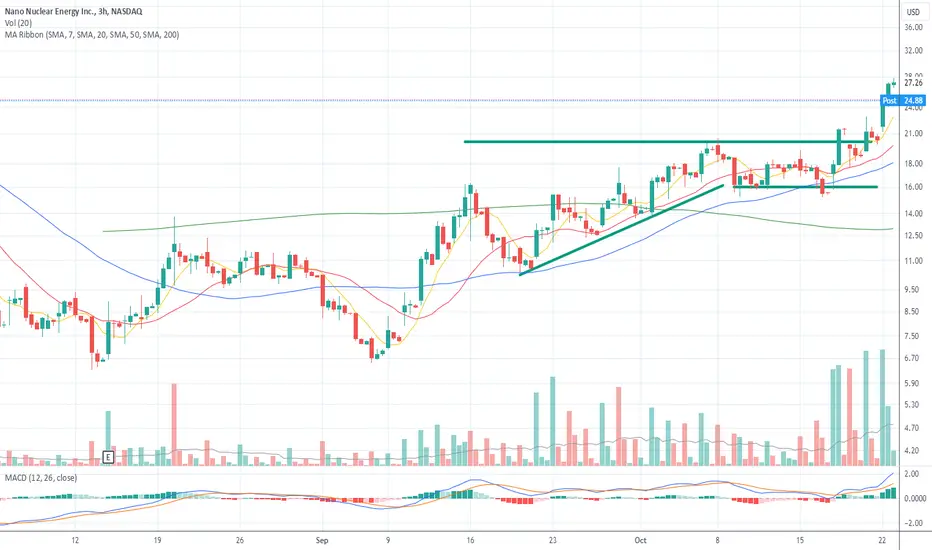
 NNE Graph illustration in practice:
It's not very clean when there is high volatility, but the principle remains the same.
First bullish leg of more than 30% (here +100%), higher lows, volatility contraction, price riding the moving averages (-> the Fork Toto), formation of a tight base -> pattern like RDM or VCP 🔥🔥
The difference between a pattern that works and one that doesn't lies in what fuels it.
We observe this with a change in volume behavior: large buyer volumes and low seller volumes.
In this case, the fuel is investors' interest in new AI technology.

면책사항
해당 정보와 게시물은 금융, 투자, 트레이딩 또는 기타 유형의 조언이나 권장 사항으로 간주되지 않으며, 트레이딩뷰에서 제공하거나 보증하는 것이 아닙니다. 자세한 내용은 이용 약관을 참조하세요.
면책사항
해당 정보와 게시물은 금융, 투자, 트레이딩 또는 기타 유형의 조언이나 권장 사항으로 간주되지 않으며, 트레이딩뷰에서 제공하거나 보증하는 것이 아닙니다. 자세한 내용은 이용 약관을 참조하세요.