
The MACD (Moving Average Convergence Divergence) is one of the most widely used technical indicators, helping traders identify trend direction, momentum shifts, and potential buy/sell signals.
How the MACD Works:
📌 MACD Line (Blue): The difference between the 12-period EMA and the 26-period EMA.
📌 Signal Line (Orange): A 9-period EMA of the MACD line, smoothing out signals.
📌 Histogram: Measures the difference between the MACD and Signal Line, visually representing momentum.
How to Use It for Trading:
- Bullish Crossover: When the MACD Line crosses above the Signal Line, it indicates a potential buying opportunity.
- Bearish Crossover: When the MACD Line crosses below the Signal Line, it signals a potential selling opportunity.
- Divergences: If price action moves opposite to MACD, it can indicate trend exhaustion and potential reversals.
- Histogram Strength: Expanding bars suggest strong momentum, while contracting bars indicate weakening trends.
MACD in Action (Chart Above)
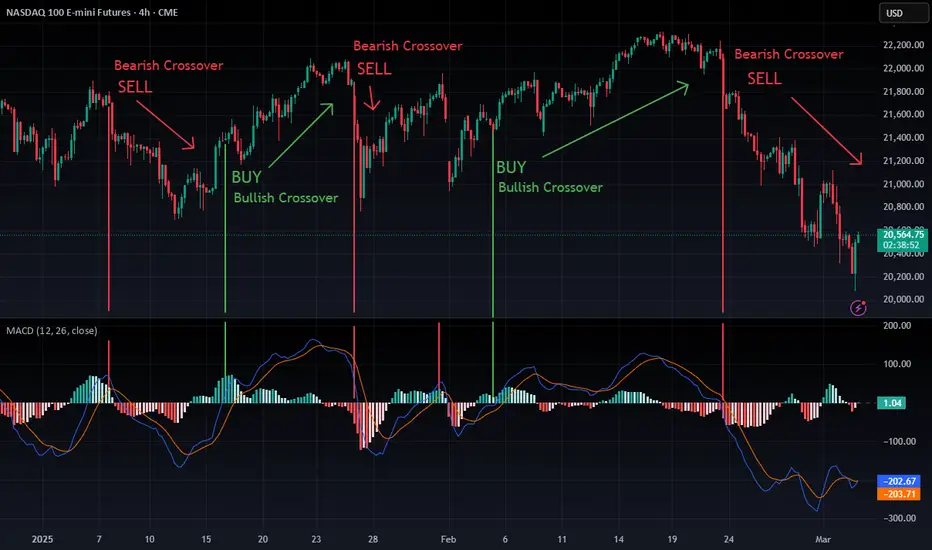
In this NASDAQ 100 chart, we see a clear bearish crossover followed by strong downward momentum. The histogram confirms the selling pressure, aligning with the price drop.
How the MACD Works:
📌 MACD Line (Blue): The difference between the 12-period EMA and the 26-period EMA.
📌 Signal Line (Orange): A 9-period EMA of the MACD line, smoothing out signals.
📌 Histogram: Measures the difference between the MACD and Signal Line, visually representing momentum.
How to Use It for Trading:
- Bullish Crossover: When the MACD Line crosses above the Signal Line, it indicates a potential buying opportunity.
- Bearish Crossover: When the MACD Line crosses below the Signal Line, it signals a potential selling opportunity.
- Divergences: If price action moves opposite to MACD, it can indicate trend exhaustion and potential reversals.
- Histogram Strength: Expanding bars suggest strong momentum, while contracting bars indicate weakening trends.
MACD in Action (Chart Above)
In this NASDAQ 100 chart, we see a clear bearish crossover followed by strong downward momentum. The histogram confirms the selling pressure, aligning with the price drop.

면책사항
해당 정보와 게시물은 금융, 투자, 트레이딩 또는 기타 유형의 조언이나 권장 사항으로 간주되지 않으며, 트레이딩뷰에서 제공하거나 보증하는 것이 아닙니다. 자세한 내용은 이용 약관을 참조하세요.
면책사항
해당 정보와 게시물은 금융, 투자, 트레이딩 또는 기타 유형의 조언이나 권장 사항으로 간주되지 않으며, 트레이딩뷰에서 제공하거나 보증하는 것이 아닙니다. 자세한 내용은 이용 약관을 참조하세요.