
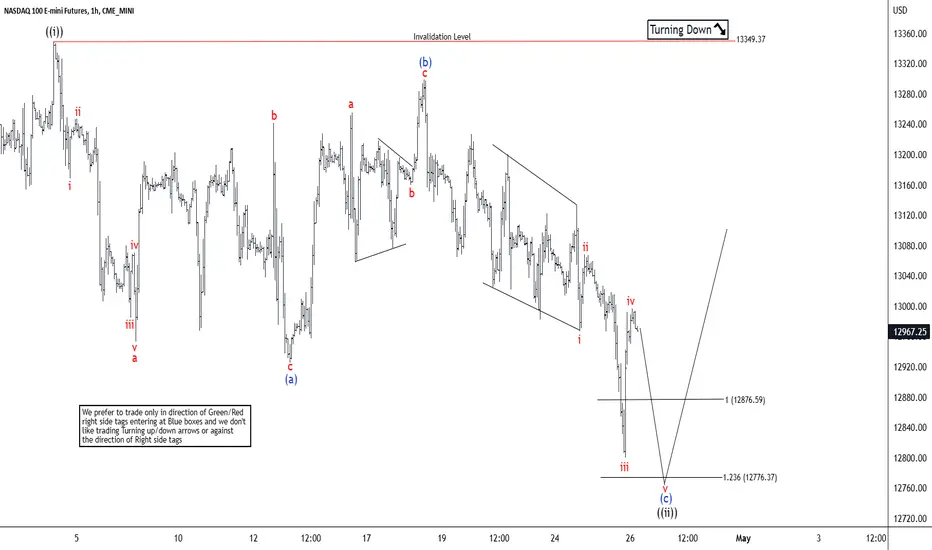
Short Term Elliott Wave in Nasdaq (NQ) suggests the Index is cycle from 3.13.2023 low ended in wave ((1)) at 13349.37 as the 1 hour chart below shows. Wave ((ii)) pullback is currently in progress to correct cycle from 3.13.2023 low. Internal subdivision of wave ((ii)) is unfolding as a double three Elliott Wave structure.
Down from wave ((i)), wave a ended at 12953.25 and wave b ended at 13241.75. Wave c lower ended at 12925.50 which completed wave (a) in higher degree. Wave (b) rally ended at 13298.75 with internal subdivision as a zigzag. Up from wave (a), wave a ended at 13255 and dips in wave b ended at 13160.25. Wave c ended at 13297.75 which completed wave (b). Wave (c) lower is in progress as 5 waves. Down from wave (b), wave i ended at 13065 and rally in wave ii ended at 13226.75. Wave iii ended at 12800. Expect wave iv to end soon and Index to turn lower in wave v to complete wave (c) of ((ii)). Potential target for wave (c) of ((ii)) is 100% – 161.8% Fibonacci extension of wave (a) which comes at 12614.1 – 12876.5.
Down from wave ((i)), wave a ended at 12953.25 and wave b ended at 13241.75. Wave c lower ended at 12925.50 which completed wave (a) in higher degree. Wave (b) rally ended at 13298.75 with internal subdivision as a zigzag. Up from wave (a), wave a ended at 13255 and dips in wave b ended at 13160.25. Wave c ended at 13297.75 which completed wave (b). Wave (c) lower is in progress as 5 waves. Down from wave (b), wave i ended at 13065 and rally in wave ii ended at 13226.75. Wave iii ended at 12800. Expect wave iv to end soon and Index to turn lower in wave v to complete wave (c) of ((ii)). Potential target for wave (c) of ((ii)) is 100% – 161.8% Fibonacci extension of wave (a) which comes at 12614.1 – 12876.5.

면책사항
해당 정보와 게시물은 금융, 투자, 트레이딩 또는 기타 유형의 조언이나 권장 사항으로 간주되지 않으며, 트레이딩뷰에서 제공하거나 보증하는 것이 아닙니다. 자세한 내용은 이용 약관을 참조하세요.
면책사항
해당 정보와 게시물은 금융, 투자, 트레이딩 또는 기타 유형의 조언이나 권장 사항으로 간주되지 않으며, 트레이딩뷰에서 제공하거나 보증하는 것이 아닙니다. 자세한 내용은 이용 약관을 참조하세요.