
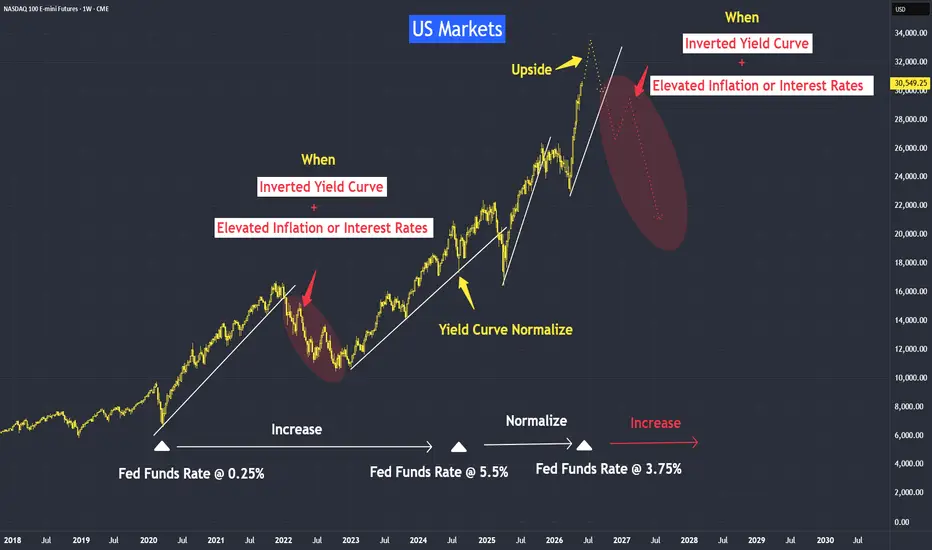
At the moment, though inflation, interest rates and yields are rising, yield curve is not inverted.
How do you spot real systemic risk in the US stock market?
It happens when the yield curve inverts. An example occurred in 2022 when short-term borrowing costs, like the 2-year yield (in yellow), exceeded longer-term borrowing costs, like the 10-year yield (in orange).
When the yield curve inverted, the 2022 stock market entered a bear market. The Nasdaq collapsed by 37%. Once the yield curve began normalizing in 2024, US markets broke above their 2021 highs. The markets then resumed the upward trend seen today.
Why do I classify US stocks as cautiously bullish? Here is why:
*US Bonds: US bonds broke below their major uptrend in 2022 and are likely to remain under pressure, risking a continuous downtrend.
*Inflation: Inflation is at risk of trending higher due to the current economic situation.
*Yield Curve: The only saving grace is that the yield curve is not currently inverted, though that risk remains.

The key is the word AND. Elevated inflation AND yield inversion.
Video version:
Micro E-mini Nasdaq-100 Index Futures and Options
Ticker: MNQ
Minimum fluctuation:
0.25 index points = $0.50
Disclaimer:
• What presented here is not a recommendation, please consult your licensed broker.
• Our mission is to create lateral thinking skills for every investor and trader, knowing when to take a calculated risk with market uncertainty and a bolder risk when opportunity arises.
CME Real-time Market Data help identify trading set-ups in real-time and express my market views. If you have futures in your trading portfolio, you can check out on CME Group data plans available that suit your trading needs tradingview.com/cme/
How do you spot real systemic risk in the US stock market?
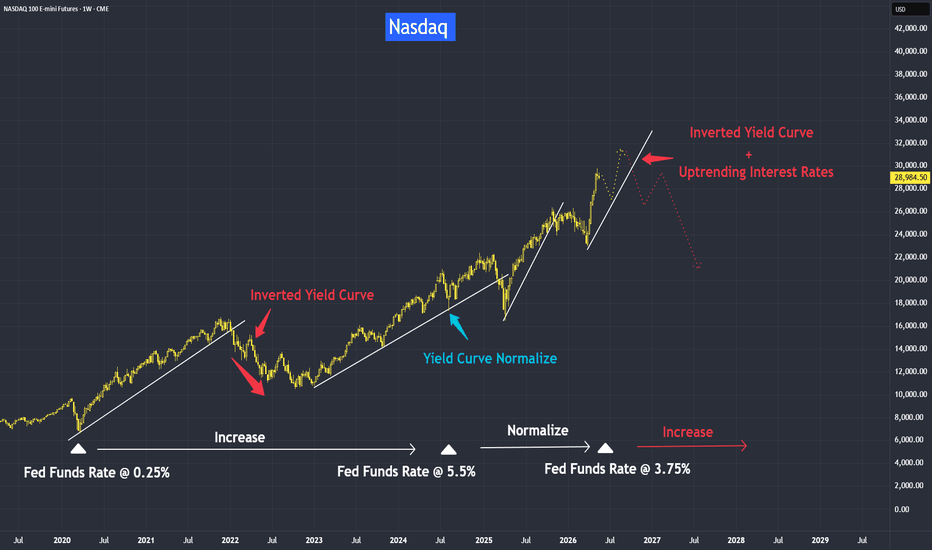
It happens when the yield curve inverts. An example occurred in 2022 when short-term borrowing costs, like the 2-year yield (in yellow), exceeded longer-term borrowing costs, like the 10-year yield (in orange).
When the yield curve inverted, the 2022 stock market entered a bear market. The Nasdaq collapsed by 37%. Once the yield curve began normalizing in 2024, US markets broke above their 2021 highs. The markets then resumed the upward trend seen today.
Why do I classify US stocks as cautiously bullish? Here is why:
*US Bonds: US bonds broke below their major uptrend in 2022 and are likely to remain under pressure, risking a continuous downtrend.
*Inflation: Inflation is at risk of trending higher due to the current economic situation.
*Yield Curve: The only saving grace is that the yield curve is not currently inverted, though that risk remains.
The key is the word AND. Elevated inflation AND yield inversion.
Video version:
Micro E-mini Nasdaq-100 Index Futures and Options
Ticker: MNQ
Minimum fluctuation:
0.25 index points = $0.50
Disclaimer:
• What presented here is not a recommendation, please consult your licensed broker.
• Our mission is to create lateral thinking skills for every investor and trader, knowing when to take a calculated risk with market uncertainty and a bolder risk when opportunity arises.
CME Real-time Market Data help identify trading set-ups in real-time and express my market views. If you have futures in your trading portfolio, you can check out on CME Group data plans available that suit your trading needs tradingview.com/cme/

konhow@weipedia.com
관련 발행물
면책사항
해당 정보와 게시물은 금융, 투자, 트레이딩 또는 기타 유형의 조언이나 권장 사항으로 간주되지 않으며, 트레이딩뷰에서 제공하거나 보증하는 것이 아닙니다. 자세한 내용은 이용 약관을 참조하세요.
관련 발행물
면책사항
해당 정보와 게시물은 금융, 투자, 트레이딩 또는 기타 유형의 조언이나 권장 사항으로 간주되지 않으며, 트레이딩뷰에서 제공하거나 보증하는 것이 아닙니다. 자세한 내용은 이용 약관을 참조하세요.