
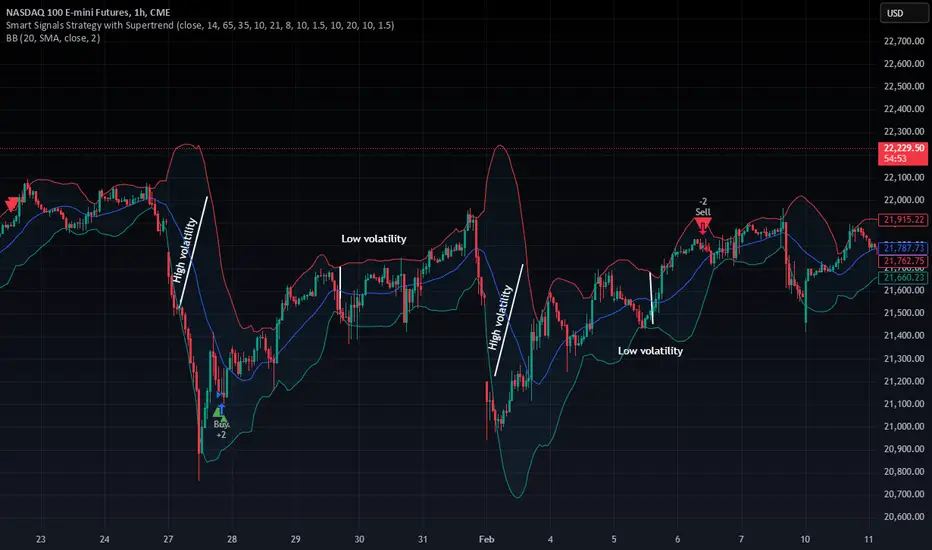
Bollinger Bands are a technical indicator used to measure market volatility and identify overbought or oversold conditions. They consist of three bands:
- Middle Band – A 20-period Simple Moving Average (SMA).
- Upper Band – SMA + 2 standard deviations (indicates overbought).
- Lower Band – SMA - 2 standard deviations (indicates oversold).
Key Strategies:
- Overbought/Oversold: Price near the upper band may indicate a reversal down, while price near the lower band suggests a potential bounce.
- Bollinger Squeeze: When bands tighten, low volatility signals a possible breakout.
- Trend Confirmation: In strong uptrends, price tends to "walk the band" near the upper side.
Trade Example:
- Buy when price bounces off the lower band with confirmation
- Sell when price touches the upper band with bearish signals.
- Stop loss: Just below the lower band in a long trade.
Always combine Bollinger Bands with volume, RSI, or MACD for better accuracy!
- Middle Band – A 20-period Simple Moving Average (SMA).
- Upper Band – SMA + 2 standard deviations (indicates overbought).
- Lower Band – SMA - 2 standard deviations (indicates oversold).
Key Strategies:
- Overbought/Oversold: Price near the upper band may indicate a reversal down, while price near the lower band suggests a potential bounce.
- Bollinger Squeeze: When bands tighten, low volatility signals a possible breakout.
- Trend Confirmation: In strong uptrends, price tends to "walk the band" near the upper side.
Trade Example:
- Buy when price bounces off the lower band with confirmation
- Sell when price touches the upper band with bearish signals.
- Stop loss: Just below the lower band in a long trade.
Always combine Bollinger Bands with volume, RSI, or MACD for better accuracy!

면책사항
해당 정보와 게시물은 금융, 투자, 트레이딩 또는 기타 유형의 조언이나 권장 사항으로 간주되지 않으며, 트레이딩뷰에서 제공하거나 보증하는 것이 아닙니다. 자세한 내용은 이용 약관을 참조하세요.
면책사항
해당 정보와 게시물은 금융, 투자, 트레이딩 또는 기타 유형의 조언이나 권장 사항으로 간주되지 않으며, 트레이딩뷰에서 제공하거나 보증하는 것이 아닙니다. 자세한 내용은 이용 약관을 참조하세요.