
#NASDAQ #NQM2020 #1hr
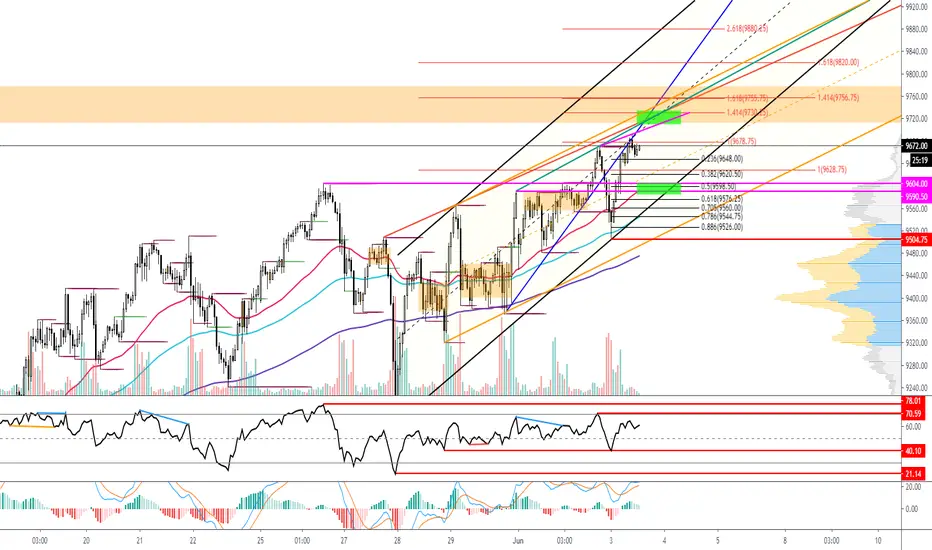
- Here is NASDAQ 1hr chart. It recently broke the blue uptrend line below and dropped down making a low around 9505. After that it bounced right back up.
- This V shaped kind of patterns appear a lot these days where a lot of retail traders get mashed.
- Within 7 hours, if we see more bullish momentum, based on the top of the many channels, trendlines, and previous sideway volumes, we can expect some resistance at 9710~9735.
- On the other hand, if NASDAQ goes through more correction, we might expect some support at 9585~9605. However, entering long position at this area seems a little risky. When some more corrective wave structure gets formed, I will be updating.
- Here is NASDAQ 1hr chart. It recently broke the blue uptrend line below and dropped down making a low around 9505. After that it bounced right back up.
- This V shaped kind of patterns appear a lot these days where a lot of retail traders get mashed.
- Within 7 hours, if we see more bullish momentum, based on the top of the many channels, trendlines, and previous sideway volumes, we can expect some resistance at 9710~9735.
- On the other hand, if NASDAQ goes through more correction, we might expect some support at 9585~9605. However, entering long position at this area seems a little risky. When some more corrective wave structure gets formed, I will be updating.

토미 유튜브: youtube.com/@TommyTradingTV
제 모든 인사이트, 분석, 관점은 t.me/tommy_trading 에 가장 먼저 올라갑니다!
제 모든 인사이트, 분석, 관점은 t.me/tommy_trading 에 가장 먼저 올라갑니다!
면책사항
해당 정보와 게시물은 금융, 투자, 트레이딩 또는 기타 유형의 조언이나 권장 사항으로 간주되지 않으며, 트레이딩뷰에서 제공하거나 보증하는 것이 아닙니다. 자세한 내용은 이용 약관을 참조하세요.
토미 유튜브: youtube.com/@TommyTradingTV
제 모든 인사이트, 분석, 관점은 t.me/tommy_trading 에 가장 먼저 올라갑니다!
제 모든 인사이트, 분석, 관점은 t.me/tommy_trading 에 가장 먼저 올라갑니다!
면책사항
해당 정보와 게시물은 금융, 투자, 트레이딩 또는 기타 유형의 조언이나 권장 사항으로 간주되지 않으며, 트레이딩뷰에서 제공하거나 보증하는 것이 아닙니다. 자세한 내용은 이용 약관을 참조하세요.