
📌 Current Price Snapshot (Latest Market Data)
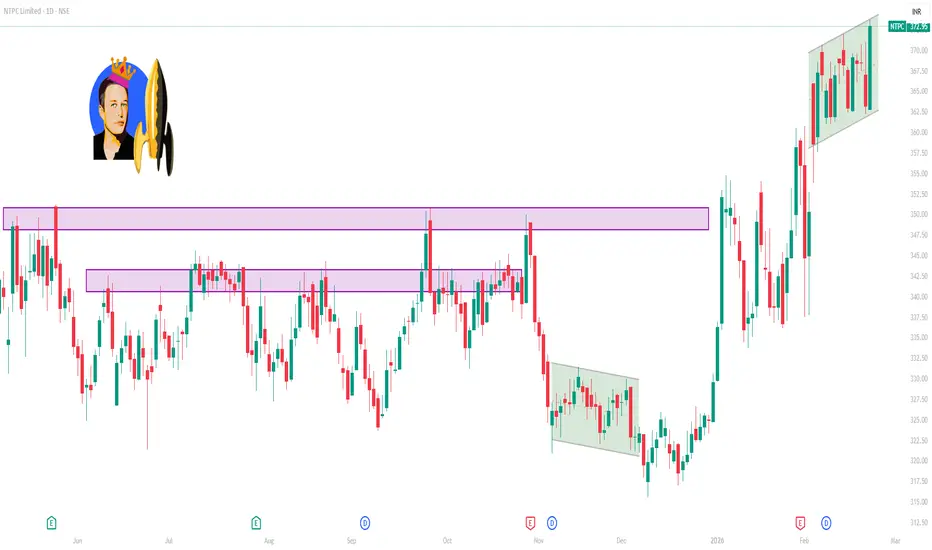
📈 NTPC’s share price has recently been trading around ₹372–₹374 on the NSE, continuing strength after recent gains and hitting near 52-week highs.
📊 Daily (1D) Technical Levels
These are derived from standard pivot point calculations and intraday technical data:
🔹 Pivot / Reference
• Daily Pivot: ~₹368.76 (central level where trading bias shifts)
🔸 Resistance Levels (Upside Targets)
R1: ~₹370.13
R2: ~₹372.01
R3: ~₹373.38 — near recent price highs
➡ If the stock stays above the pivot (~368–369) and breaches R2/R3, upside momentum may sustain during the session.
🔹 Support Levels (Downside Zones)
S1: ~₹366.88
S2: ~₹365.51
S3: ~₹363.63 — deeper intraday support
➡ Below the Pivot (~368) and especially below S2/S3, intraday weakness or pullback risks increase.
🧠 Indicator Snapshot (Short-Term Bias)
RSI (14): ~63.9 — generally neutral-to-mild bullish territory.
MACD: slightly bearish signal recently.
This mixed indicator picture suggests momentum is present but not deeply overbought, so watch price action around the pivot and first resistance/support zones closely.
📉 Moving Average Context
Key moving averages near current prices also act as dynamic support/resistance:
10D SMA ~367, 20D ~361, 50D ~345 — all below current price, indicating short-term bullish structure.
📈 NTPC’s share price has recently been trading around ₹372–₹374 on the NSE, continuing strength after recent gains and hitting near 52-week highs.
📊 Daily (1D) Technical Levels
These are derived from standard pivot point calculations and intraday technical data:
🔹 Pivot / Reference
• Daily Pivot: ~₹368.76 (central level where trading bias shifts)
🔸 Resistance Levels (Upside Targets)
R1: ~₹370.13
R2: ~₹372.01
R3: ~₹373.38 — near recent price highs
➡ If the stock stays above the pivot (~368–369) and breaches R2/R3, upside momentum may sustain during the session.
🔹 Support Levels (Downside Zones)
S1: ~₹366.88
S2: ~₹365.51
S3: ~₹363.63 — deeper intraday support
➡ Below the Pivot (~368) and especially below S2/S3, intraday weakness or pullback risks increase.
🧠 Indicator Snapshot (Short-Term Bias)
RSI (14): ~63.9 — generally neutral-to-mild bullish territory.
MACD: slightly bearish signal recently.
This mixed indicator picture suggests momentum is present but not deeply overbought, so watch price action around the pivot and first resistance/support zones closely.
📉 Moving Average Context
Key moving averages near current prices also act as dynamic support/resistance:
10D SMA ~367, 20D ~361, 50D ~345 — all below current price, indicating short-term bullish structure.

Contact Knowledgehub for a detailed consultation: Dm on WhatsApp: [wa.link/a2o0kz]-
Phone No: [+91 93102 26243]-
Email: [tradingviewknowledgehub@gmail.com]---
-- Let’s achieve success together!
Phone No: [+91 93102 26243]-
Email: [tradingviewknowledgehub@gmail.com]---
-- Let’s achieve success together!
관련 발행물
면책사항
해당 정보와 게시물은 금융, 투자, 트레이딩 또는 기타 유형의 조언이나 권장 사항으로 간주되지 않으며, 트레이딩뷰에서 제공하거나 보증하는 것이 아닙니다. 자세한 내용은 이용 약관을 참조하세요.
Contact Knowledgehub for a detailed consultation: Dm on WhatsApp: [wa.link/a2o0kz]-
Phone No: [+91 93102 26243]-
Email: [tradingviewknowledgehub@gmail.com]---
-- Let’s achieve success together!
Phone No: [+91 93102 26243]-
Email: [tradingviewknowledgehub@gmail.com]---
-- Let’s achieve success together!
관련 발행물
면책사항
해당 정보와 게시물은 금융, 투자, 트레이딩 또는 기타 유형의 조언이나 권장 사항으로 간주되지 않으며, 트레이딩뷰에서 제공하거나 보증하는 것이 아닙니다. 자세한 내용은 이용 약관을 참조하세요.