
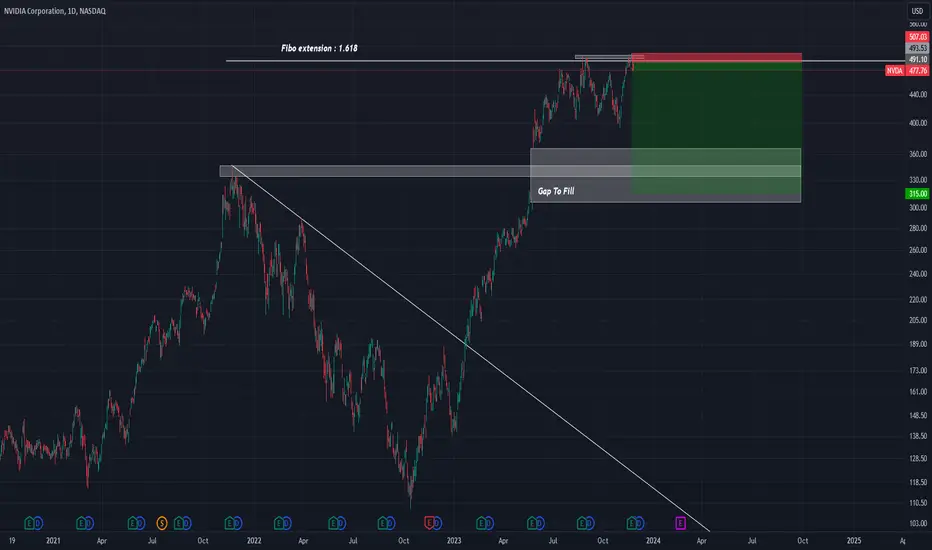
After a very big bull phase on the NVDA Stock, we start to see some reversal pattern on the 1.618 fibonacci level of extension. We can see the formation of lower lows and a stop hunting at the top (and near the extension level we are looking at).
What are we looking from ?
First we want to see the recent gap to be filled on this swing position (around the $315.0 level and the $306.0 50% of Fibonacci will be great but we can also see the $280.0 level of interest).
Then potentially, we can wait to see a bounce on this level for a long (but we are not here for now).
For me it's a strong short bias on this asset with decent R:R.
Great Trade !
What are we looking from ?
First we want to see the recent gap to be filled on this swing position (around the $315.0 level and the $306.0 50% of Fibonacci will be great but we can also see the $280.0 level of interest).
Then potentially, we can wait to see a bounce on this level for a long (but we are not here for now).
For me it's a strong short bias on this asset with decent R:R.
Great Trade !
노트
Level of support to watch : $468.0We want this level to break for a great continuation on the down side
This level can also be the level where we put the stop to BE and/or take a little profit
노트
Short seller are very strong on this assetLove to see the $475.0 level get rejected, so now we wait for the price to make new lows

면책사항
해당 정보와 게시물은 금융, 투자, 트레이딩 또는 기타 유형의 조언이나 권장 사항으로 간주되지 않으며, 트레이딩뷰에서 제공하거나 보증하는 것이 아닙니다. 자세한 내용은 이용 약관을 참조하세요.
면책사항
해당 정보와 게시물은 금융, 투자, 트레이딩 또는 기타 유형의 조언이나 권장 사항으로 간주되지 않으며, 트레이딩뷰에서 제공하거나 보증하는 것이 아닙니다. 자세한 내용은 이용 약관을 참조하세요.