
Nvidia (NVDA) shares popped 5% in extended trading on Wednesday after the AI favorite posted quarterly results well above Wall Street expectations and issued a strong sales forecast, signaling that the AI boom is showing no signs of slowing.
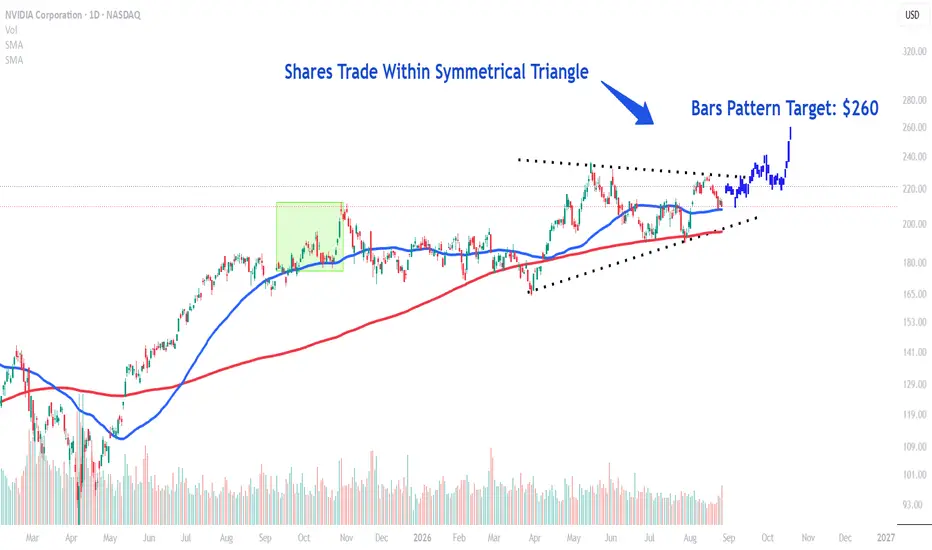
Taking a closer look at NVDA's chart, the shares have traded within a multi-month symmetrical triangle, potentially indicating accumulation by institutional investors before the stock continues its longer-term uptrend. More recently, the price has retraced to the closely-watched 50 moving average (MA) ahead of today's earnings report.
Traders can project a bullish target by using TradingView's bar pattern tool. To apply the analysis, we take the price bars comprising a move higher following a similar-sized gap after a pullback to the 50 MA in September last year and overlay them from Thursday's projected opening price. This forecasts a move to around $260, implying around 24% upside from Wednesday's closing price.

면책사항
해당 정보와 게시물은 금융, 투자, 트레이딩 또는 기타 유형의 조언이나 권장 사항으로 간주되지 않으며, 트레이딩뷰에서 제공하거나 보증하는 것이 아닙니다. 자세한 내용은 이용 약관을 참조하세요.
면책사항
해당 정보와 게시물은 금융, 투자, 트레이딩 또는 기타 유형의 조언이나 권장 사항으로 간주되지 않으며, 트레이딩뷰에서 제공하거나 보증하는 것이 아닙니다. 자세한 내용은 이용 약관을 참조하세요.