
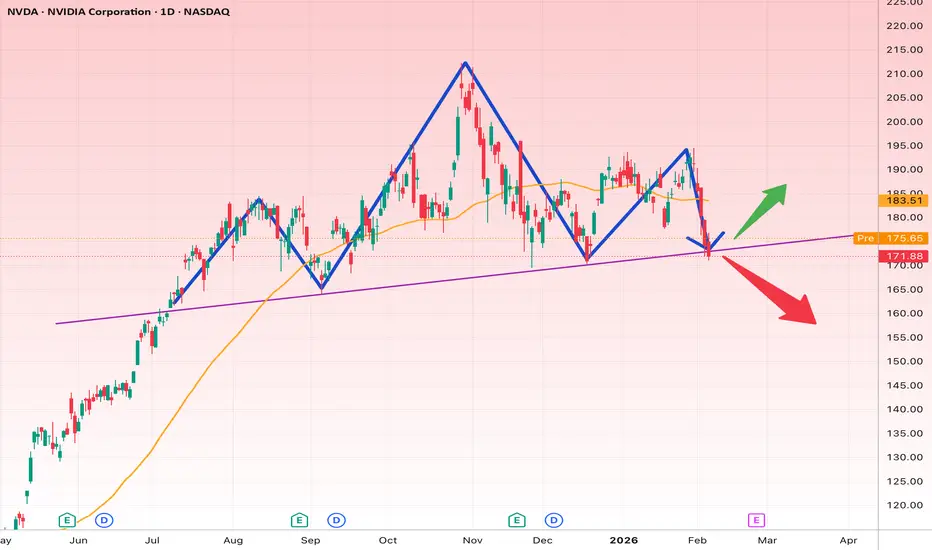
Price is sitting right on a rising trendline support around 172–175, which is a key decision zone.
Bullish scenario:
If this support holds, a rebound toward 183–190 is likely, aligning with prior swing highs and the moving average.
Bearish scenario:
A daily close below ~170 would signal a breakdown, opening downside toward 160–155.
Bias: Neutral → bullish only if trendline support holds.
Invalidation / Stop-loss: Below 170 (daily close).
This is a classic make-or-break level — wait for confirmation before committing.
Bullish scenario:
If this support holds, a rebound toward 183–190 is likely, aligning with prior swing highs and the moving average.
Bearish scenario:
A daily close below ~170 would signal a breakdown, opening downside toward 160–155.
Bias: Neutral → bullish only if trendline support holds.
Invalidation / Stop-loss: Below 170 (daily close).
This is a classic make-or-break level — wait for confirmation before committing.

면책사항
해당 정보와 게시물은 금융, 투자, 트레이딩 또는 기타 유형의 조언이나 권장 사항으로 간주되지 않으며, 트레이딩뷰에서 제공하거나 보증하는 것이 아닙니다. 자세한 내용은 이용 약관을 참조하세요.
면책사항
해당 정보와 게시물은 금융, 투자, 트레이딩 또는 기타 유형의 조언이나 권장 사항으로 간주되지 않으며, 트레이딩뷰에서 제공하거나 보증하는 것이 아닙니다. 자세한 내용은 이용 약관을 참조하세요.