
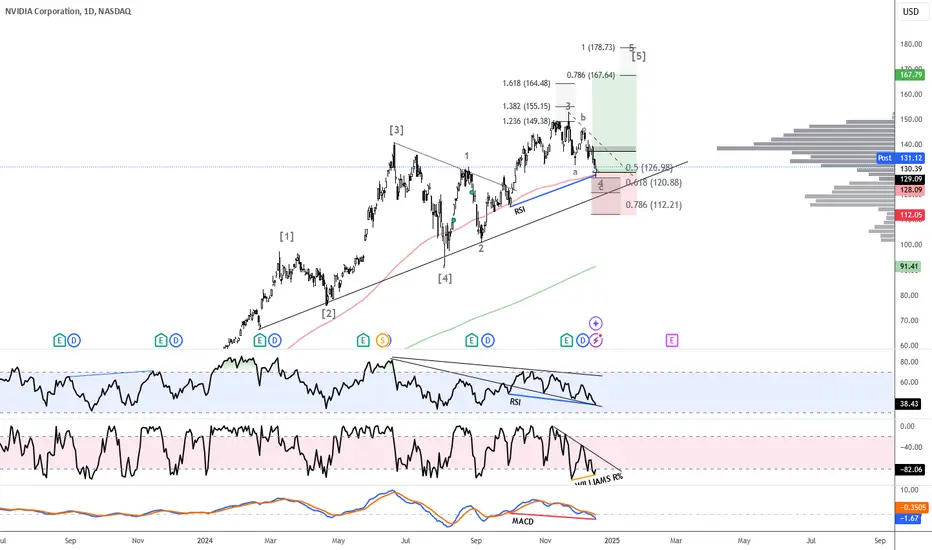
NVIDIA Corporation (NVDA) shows signs of a potential rebound based on Elliott Wave Theory and key technical indicators. The chart suggests that NVDA has likely completed a corrective Wave 4 and could be entering Wave 5, signaling a continuation of its primary bullish trend. Divergences in the Relative Strength Index (RSI), MACD, and Williams %R indicate that the recent pullback may be temporary.
The RSI shows a bullish divergence, with higher lows on the indicator while the price made lower lows, a common precursor to upward momentum. The MACD has turned upward, with a bullish crossover suggesting increasing buying interest. The Williams %R, which measures overbought and oversold conditions, also shows a divergence, indicating the stock may have been oversold and could be ready to reverse.
NVIDIA’s strong fundamentals, driven by increasing demand for AI infrastructure and GPUs, support this technical setup. Compared to gold and U.S. Treasury bonds, which have stabilized with minimal growth potential, NVIDIA offers significant upside as the chart signals a potential reversal and renewed bullish momentum.
The RSI shows a bullish divergence, with higher lows on the indicator while the price made lower lows, a common precursor to upward momentum. The MACD has turned upward, with a bullish crossover suggesting increasing buying interest. The Williams %R, which measures overbought and oversold conditions, also shows a divergence, indicating the stock may have been oversold and could be ready to reverse.
NVIDIA’s strong fundamentals, driven by increasing demand for AI infrastructure and GPUs, support this technical setup. Compared to gold and U.S. Treasury bonds, which have stabilized with minimal growth potential, NVIDIA offers significant upside as the chart signals a potential reversal and renewed bullish momentum.
액티브 트레이드
+2% in pre-market rn 🚀 노트
SL -> BE거래청산: 타겟 닿음
노트
Took all out at the last high**
면책사항
해당 정보와 게시물은 금융, 투자, 트레이딩 또는 기타 유형의 조언이나 권장 사항으로 간주되지 않으며, 트레이딩뷰에서 제공하거나 보증하는 것이 아닙니다. 자세한 내용은 이용 약관을 참조하세요.
면책사항
해당 정보와 게시물은 금융, 투자, 트레이딩 또는 기타 유형의 조언이나 권장 사항으로 간주되지 않으며, 트레이딩뷰에서 제공하거나 보증하는 것이 아닙니다. 자세한 내용은 이용 약관을 참조하세요.