
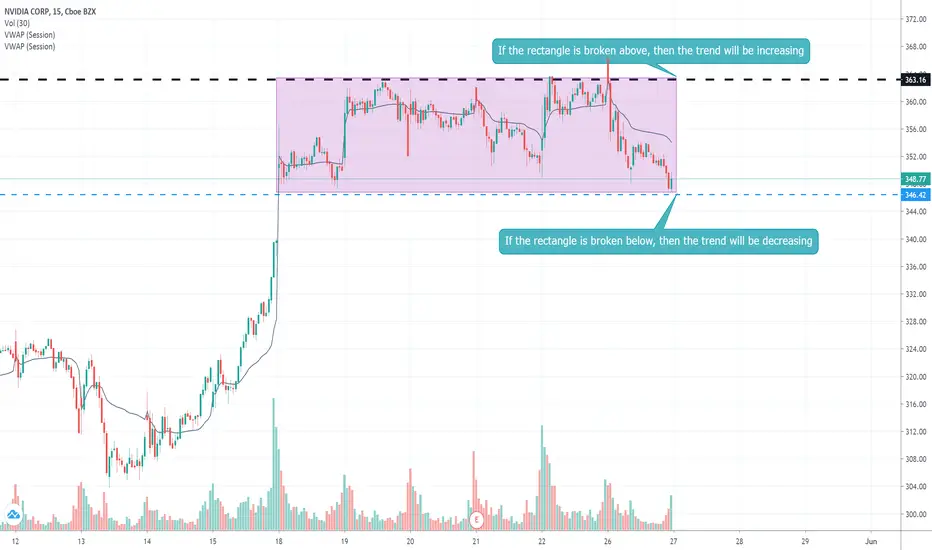
As shown in the graph, it seems there is an equilibrium during a certain period (Period specified by the rectangle.
Any huge break of this rectangle gives an idea about the trend of the stock price. if it breaks it down, the stock has a good chance to b decreasing, however, if it an up break, the stock will be increasing.
If none of these cases were realized, the NVIDIA stock will continue its equilibrium.
Any huge break of this rectangle gives an idea about the trend of the stock price. if it breaks it down, the stock has a good chance to b decreasing, however, if it an up break, the stock will be increasing.
If none of these cases were realized, the NVIDIA stock will continue its equilibrium.

면책사항
해당 정보와 게시물은 금융, 투자, 트레이딩 또는 기타 유형의 조언이나 권장 사항으로 간주되지 않으며, 트레이딩뷰에서 제공하거나 보증하는 것이 아닙니다. 자세한 내용은 이용 약관을 참조하세요.
면책사항
해당 정보와 게시물은 금융, 투자, 트레이딩 또는 기타 유형의 조언이나 권장 사항으로 간주되지 않으며, 트레이딩뷰에서 제공하거나 보증하는 것이 아닙니다. 자세한 내용은 이용 약관을 참조하세요.