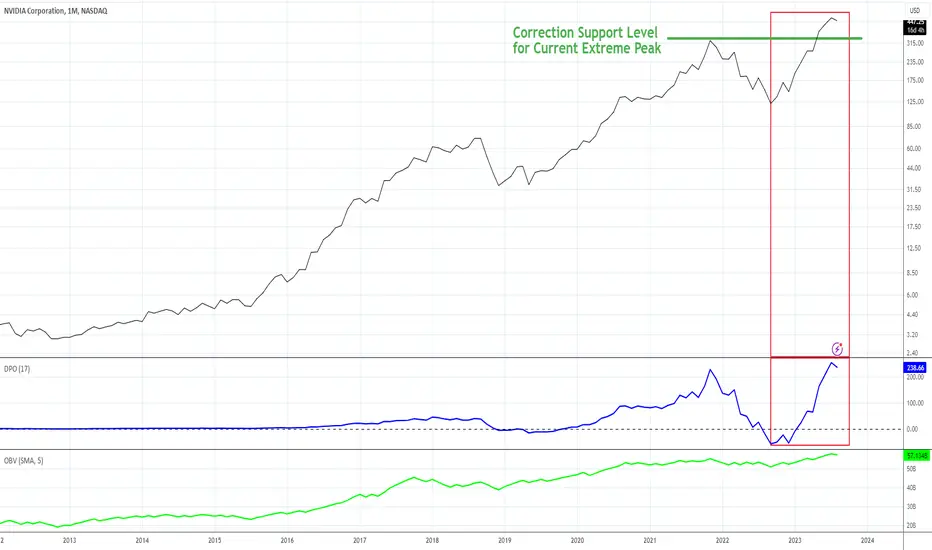
Yesterday's Top Gainer for the NASDAQ has found support at a precise technical level. This is usually technical professional traders. There could also be a few Dark Pools in the mix.

DPO Cycle Chart: The Detrending Price Oscillator I use to show the long-term cycle of a stock shows an Extreme Peak which needs to pattern out with the stock shifting sideways for a while. The Extreme Peak is not necessarily an exhaustion of trend pattern.
Between 2007 and 2020, AAPL had 4 Extreme peaks, corrected and resumed the uptrend between each peak. Troughs were shallow during those years.
 NVDA needs to shift into a platform or other sideways trend to pattern out the Extreme Upward Cycle Peak. Otherwise, at some point, the over-speculated price will become a correction on the short-term or intermediate-term trend. This means that NVDA can move higher for a while BUT this is not an ideal long-term entry level until it patterns out that extreme peak.
DPO Cycle Chart: The Detrending Price Oscillator I use to show the long-term cycle of a stock shows an Extreme Peak which needs to pattern out with the stock shifting sideways for a while. The Extreme Peak is not necessarily an exhaustion of trend pattern.
Between 2007 and 2020,
AAPL had 4 Extreme peaks, corrected and resumed the uptrend between each peak. Troughs were shallow during those years.NVDA needs to shift into a platform or other sideways trend to pattern out the Extreme Upward Cycle Peak. Otherwise, at some point, the over-speculated price will become a correction on the short-term or intermediate-term trend. This means that NVDA can move higher for a while BUT this is not an ideal long-term entry level until it patterns out that extreme peak.
Martha Stokes, CMT
Chartered Market Technician
Co-founder, CEO & Head Instructor at TechniTrader
Learn more at the TechniTrader Learning Center: ttrader.im/learning-center
Chartered Market Technician
Co-founder, CEO & Head Instructor at TechniTrader
Learn more at the TechniTrader Learning Center: ttrader.im/learning-center
관련 발행물
면책사항
해당 정보와 게시물은 금융, 투자, 트레이딩 또는 기타 유형의 조언이나 권장 사항으로 간주되지 않으며, 트레이딩뷰에서 제공하거나 보증하는 것이 아닙니다. 자세한 내용은 이용 약관을 참조하세요.